Latest version: v2024.09.20-cancer
This boostDM release has been implemented with the output produced by Intogen v2024.09.20. Several improvements and features have been included, including changes in model implementation, reference datasets and bugfixes.
Herein we describe the main technical changes, we summarize the new output of the pipeline and provide a comparison with the previous release.
Although mutational cluster features (OncodriveCLUSTL, HotMAPS and smRegions) are generated on a cohort-by-cohort basis, boostDM models are specified by tumor-type, meaning that an aggregation or consensus step has to be taken in order to annotate the mutations in the training and test sets.
In the previous release, mutations with the same genomic identity (same genomic coordinates and alternate allele) would be annotated with different mutational cluster feature values depending on which cohort they were originally reported in, thereby yielding instances of mutations with same identity but different cluster feature values across samples of the same tumor type.
In the current version we have changed this criterion. Now if a mutation is mapped by a clustering feature in some cohort belonging to a given tumor type, all the instances of the mutation across the tumor type will get the same cluster feature value in the training and prediction corresponding to this tumor type.
Each cluster method (OncodriveCLUSTL, HotMAPS and smRegions) is now associated with a single ordinal feature with three levels:
2 - the mutation is associated to a cluster in the same tumor type1 - the mutation is only associated to a cluster in another tumor type0 - the mutation is not associated to the cluster in any case
Therefore we no longer keep the distinction between cat_1 and cat_2 binary-encoded cluster features. Moreover, we do not use the OncodriveCLUSTL_SCORE numerical feature anymore due to the little gain in predictive ability and explainability along with the added complexity at interpreting the feature contributions at prediction.
The forecast aggregator combining the 50 base classifiers per model is now unweighted, meaning that the base classifiers are no longer favored or penalized based on their cross-validation performance. Particularly in those cases where the cross-validation test set remaining after removing repeated mutation instances is very small, the performance score of a single base classifier can be biased and misleading to determine whether the base classifier behavior needs to be promoted in the forecast aggregator.
Our model selection strategy is now conducted in two steps:
F-score50 across base classifier >= 0.8
We have updated step 2 by changing the discovery index tiers and the minimum number of observed mutations for each tier. The new step 2 reads in Python code as follows:
DISCOVERY_TIERS = (0, 0.5, 0.75)
MUTATION_TIERS = (50, 30, 0)
FSCORE_THRESHOLD = 0.8

def meet_condition(fscore, discovery, n_muts):
  if fscore >= FSCORE_THRESHOLD:
    for discovery_thresh, n_muts_thresh in zip(DISCOVERY_TIERS, MUTATION_TIERS):
      if (discovery >= discovery_thresh) and (n_muts >= n_muts_thresh):
          return True
  return False
The rationale behind this change is that it is very difficult to assert qualitative differences between discovery index values within the (0, 0.5) range, making a case subdivision in this range not well justified. Therefore by providing broader discovery index tiers we make sure to provide more qualitatively distinct discovery classes.
We no more train meta-gene models based on the dichotomous mode-of-action classification into oncogenes (Act) and tumor suppressor (LoF) genes. This is in part because the models end up being dominated by a few genes contributing more mutations to each Act or LoF class. The pipeline now only renders models that are gene-specific. Consequently the oncogenic mode-of-action or “role” of the gene as a feature is no longer used. As a result, the column “selected_model_gene” is no longer used in the in silico saturation mutagenesis output tables.
The in silico saturation mutagenesis output is displayed with some formatting differences, with filenames consistent with the expression [gene].model.[ttype_model].features.[ttype_features].prediction.tsv.gz. The term ttype_model represents the tumor type used as training context, the set of cohorts where the signals of positive selection were calculated and from which the training mutations were taken for the specific model used to cast the prediction, i.e., in which tumor type context the model was learned. The term ttype_features is the tumor type corresponding to the features that are used to encode the input mutation as a vector of feature values for prediction, i.e., the tumor type of the query mutation. In this release, we provide in silico saturation mutagenesis outputs where the predictive model has been trained in the same tumor type context of the query mutation. As a consequence of making explicit the context of the training and the query, the column selected_model_ttype is no longer part of the output tables.
The current version uses the outputs of Intogen v2024.09.20.
The new release uses ENSEMBL Variant Effect Predictor (VEP) v.111 annotations instead of ENSEMBL VEP v.92.
Ensembl canonical transcripts are no longer the reference transcripts in order to interpret relevant sites and the consequence type of the mutations. The current release is built on the MANE (Matched Annotation from NCBI and EMBL-EBI) transcripts. We have switched to using MANE Select transcripts to align with common standards used in the clinics. This redefinition of the transcript is in accordance with the current Intogen release v2024.09.20, where it has an impact on the regions used in methods like OncodriveFML, OncodriveCLUSTLand and smRegions, also when computing the mutational profiles and when building coding sequence regions for dNdScv.
In the current release, the genomic regions considered for training and prediction include the entire coding sequence according to MANE Select, including stop codons (as in the previous release) as well as the 5 noncoding base-pairs flanking each exonic coding sequence segment. The inclusion of the non coding base-pairs intends to exploit the signals of positive selection cast by noncoding splicing-affecting mutations. The mapping is done according to the MANE Select transcripts retrieved from VEP v.111.
We have extended the set of sequence ontology (SO) terms that map to the consequence classification we employ in the pipeline, which consists of four consequence types: “missense”, “nonsense”, “splicing” and “synonymous”.
nonsense now includes the SO terms:stop_gainedstop_loststart_lostsplicing now include the SO terms:splice_donor_variantsplice_acceptor_variantsplice_region_variantsplice_donor_5th_base_variantsplice_donor_region_variantsplice_polypyrimidine_tract_variantintron_variantWe have updated the version of Pfam to v35.0.
As tumor type ontology for hierarchical model implementation across tumor types we now use the oncotree version boostdm2023 (see Downloads) which is based on the 2021 version of the MSKCC oncotree.
Recently we found a misspecification in the codebase that prevented the randomization of passenger mutations as intended. As described in the main documentation, our method resorts to trinucleotide context probabilities derived from the observed frequencies in the cohort mutational data. With these probabilities we can then draw random mutations to create the set of passenger mutations used as a negative set in the supervised learning step.
Because of the unintended usage of a reference genome inconsistent with the rest of the pipeline in the step that converted genomic coordinates into reference triplets prior to randomization, there was a mismatch between sites and reference triplets. Consequently, the nondriver training set was drawn in a trinucleotide-agnostic way.
In the current version the hg38 genome build is consistently used throughout the entire pipeline.
The output of Intogen now generates a unified data environment for the boostDM pipeline to be run from the new outputs of Intogen with minimum preprocessing required. For more details, check out the Intogen website.
The current version of the pipeline adds two supplemental steps to streamline post-hoc analysis, including model visualization and benchmarking analysis.
All the plots used for basic model visualization in the boostDM website are automatically generated as part of a supplemental step in the pipeline. There are three types of plots:
Given the importance for post-hoc evaluation, the boostDM pipeline now includes an expanded version of the benchmarks accompanying the first release of the method (https://doi.org/10.1038/s41586-021-03771-1). We have included both experimental saturation mutagenesis datasets and bioinformatic scores retrieved through dbNSFP. Please, have a look at the full docs.
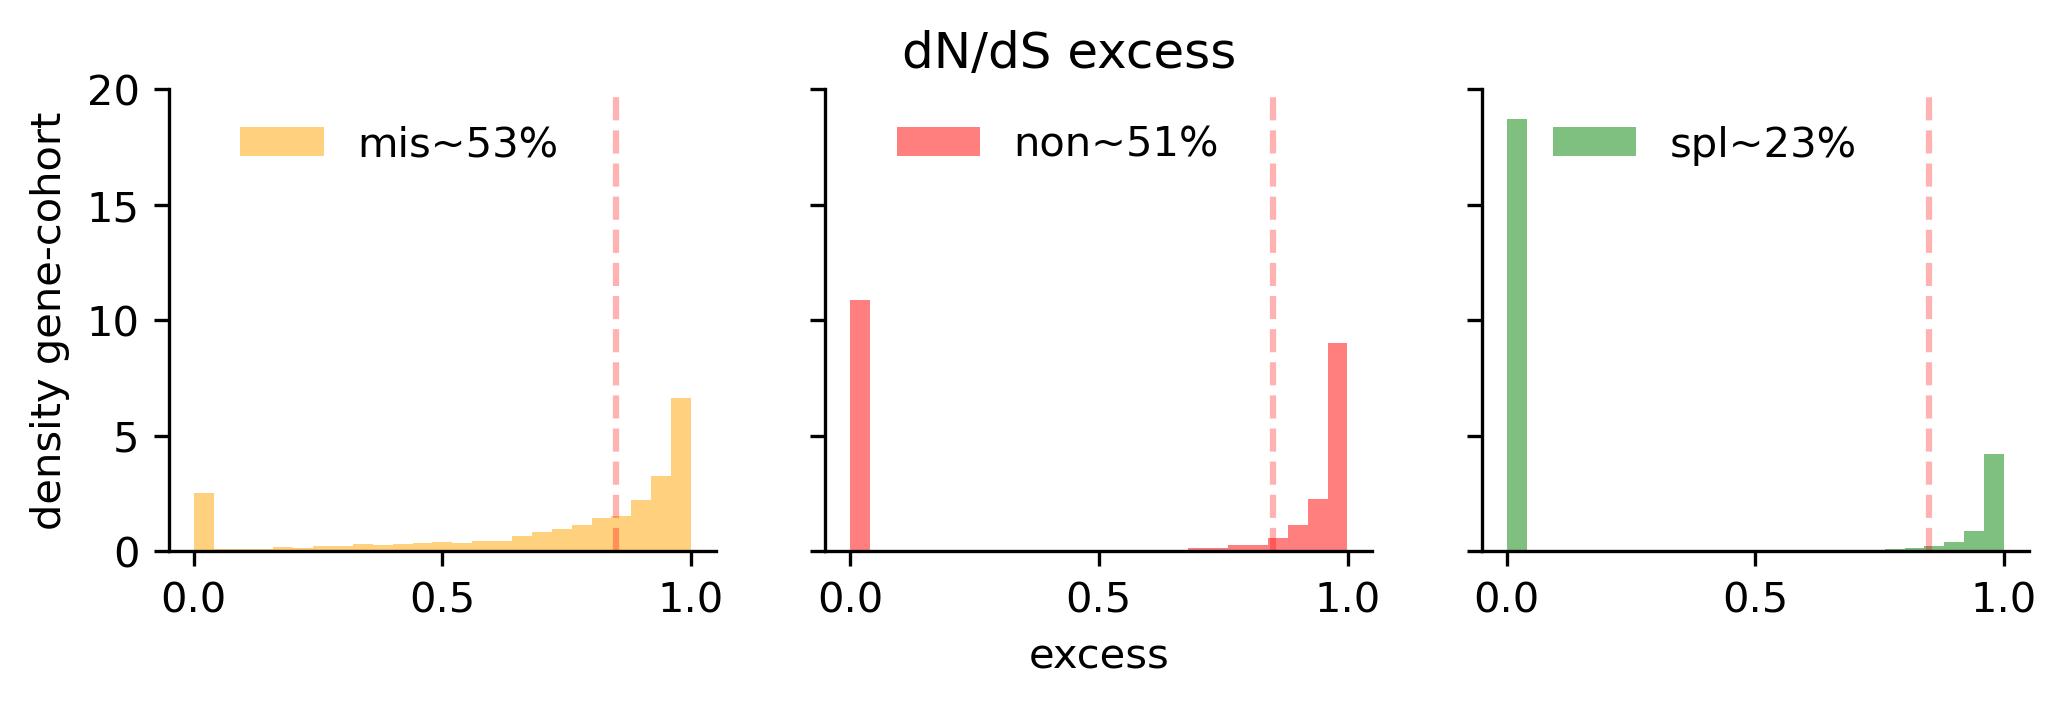
The current release of BoostDM feeds on mutations observed in a total of 4,478 driver gene cohort combinations, comprising 633 driver genes and 260 cohorts covering a total of 87 tumor types according to our oncotree ontology. Of all observed mutations mapping to the region of interest, we only consider as positive examples those mutations matching a consequence type with a dN/dS excess in the cohort higher than 85%. There is a strong dichotomy between cohorts with high and low excess in the nonsense and splicing consequence type contexts, whereas the distribution of missense excess is more gradual.
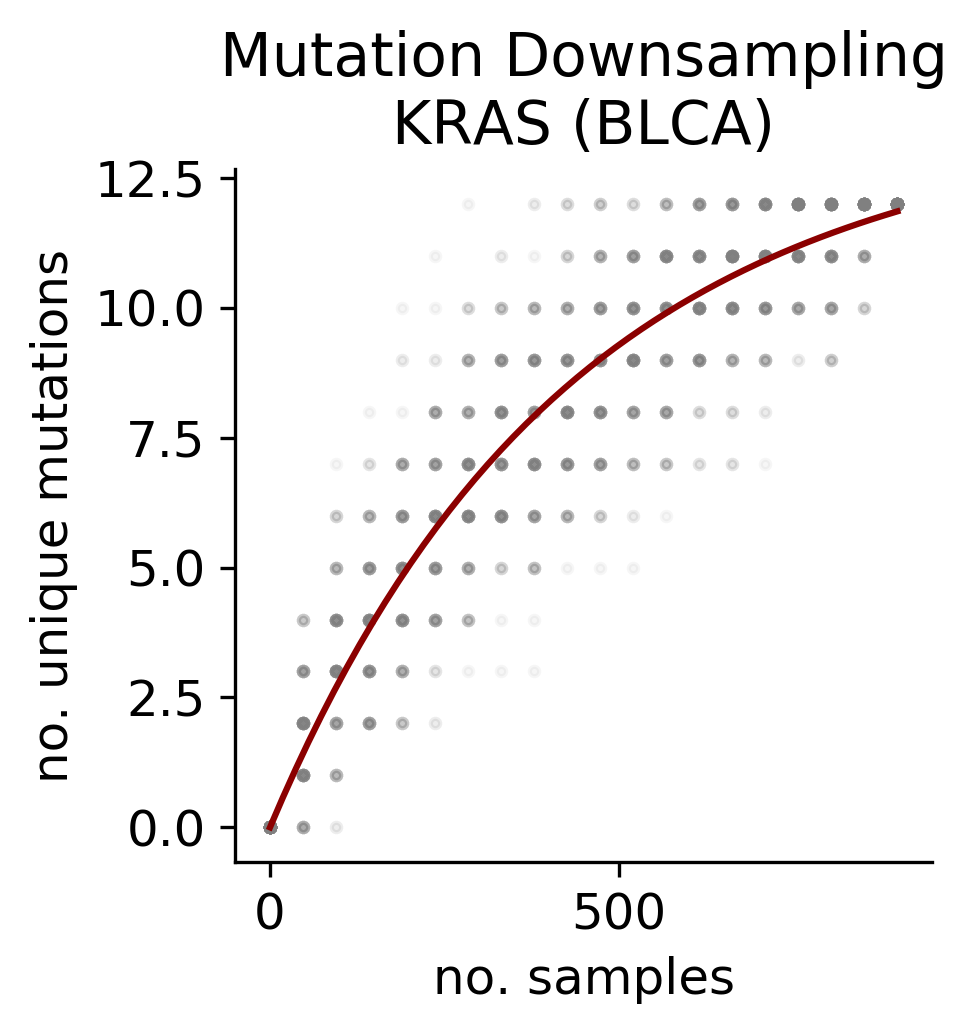
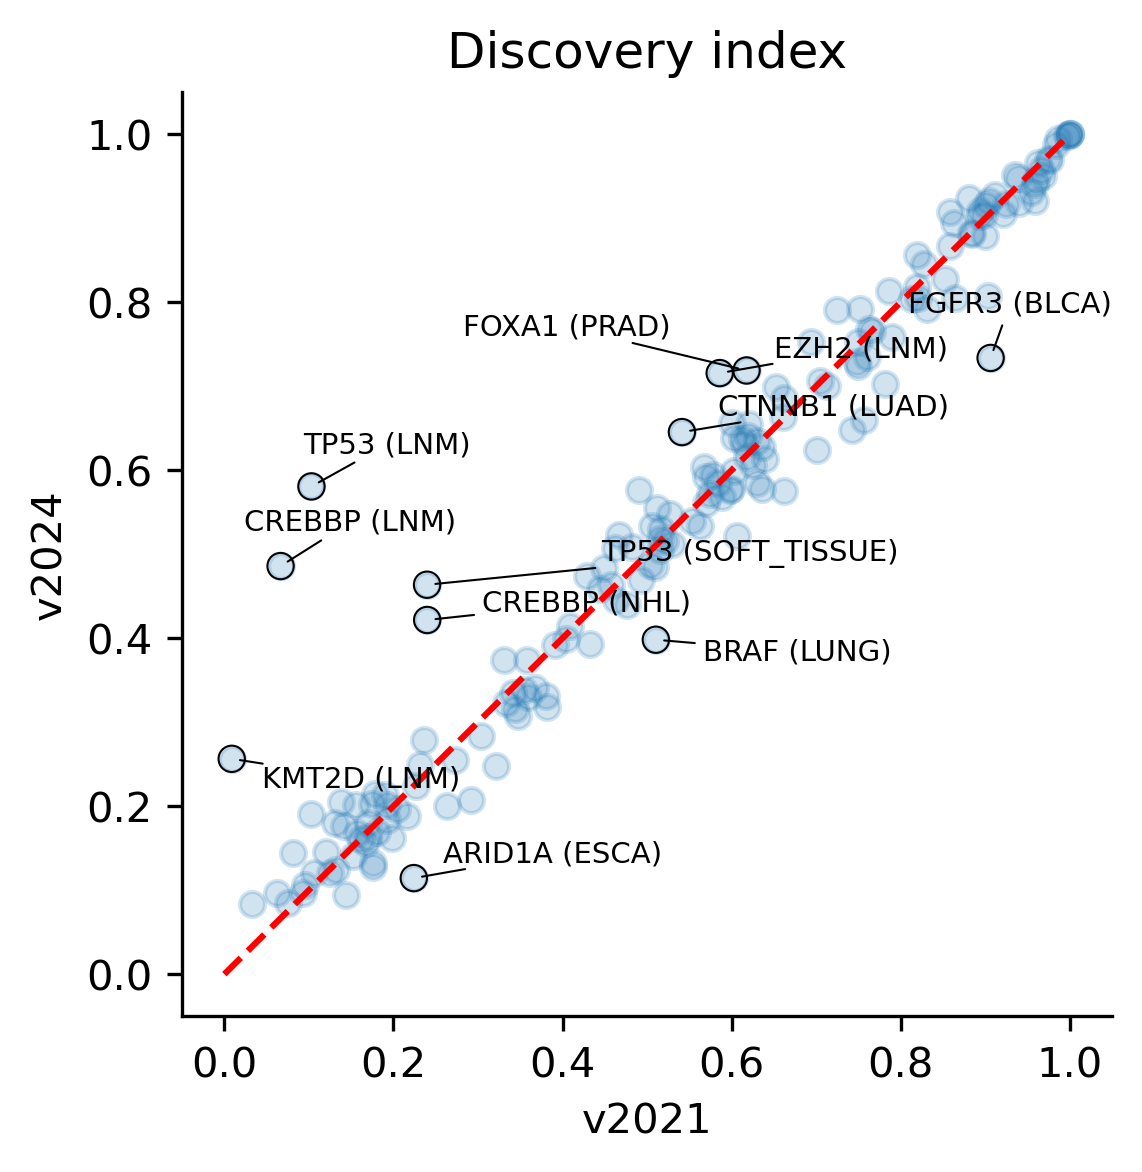
For each driver gene and tumor type combination we computed the discovery index, a score that measures how unlikely new mutations are to be found if new samples of the same tumor type were to be sequenced. The number of observed mutations in a gene and tumor type context alongside the discovery index gives us an indication of how representative our catalog of mutations is in order to derive conclusions about recurrence and driverness.
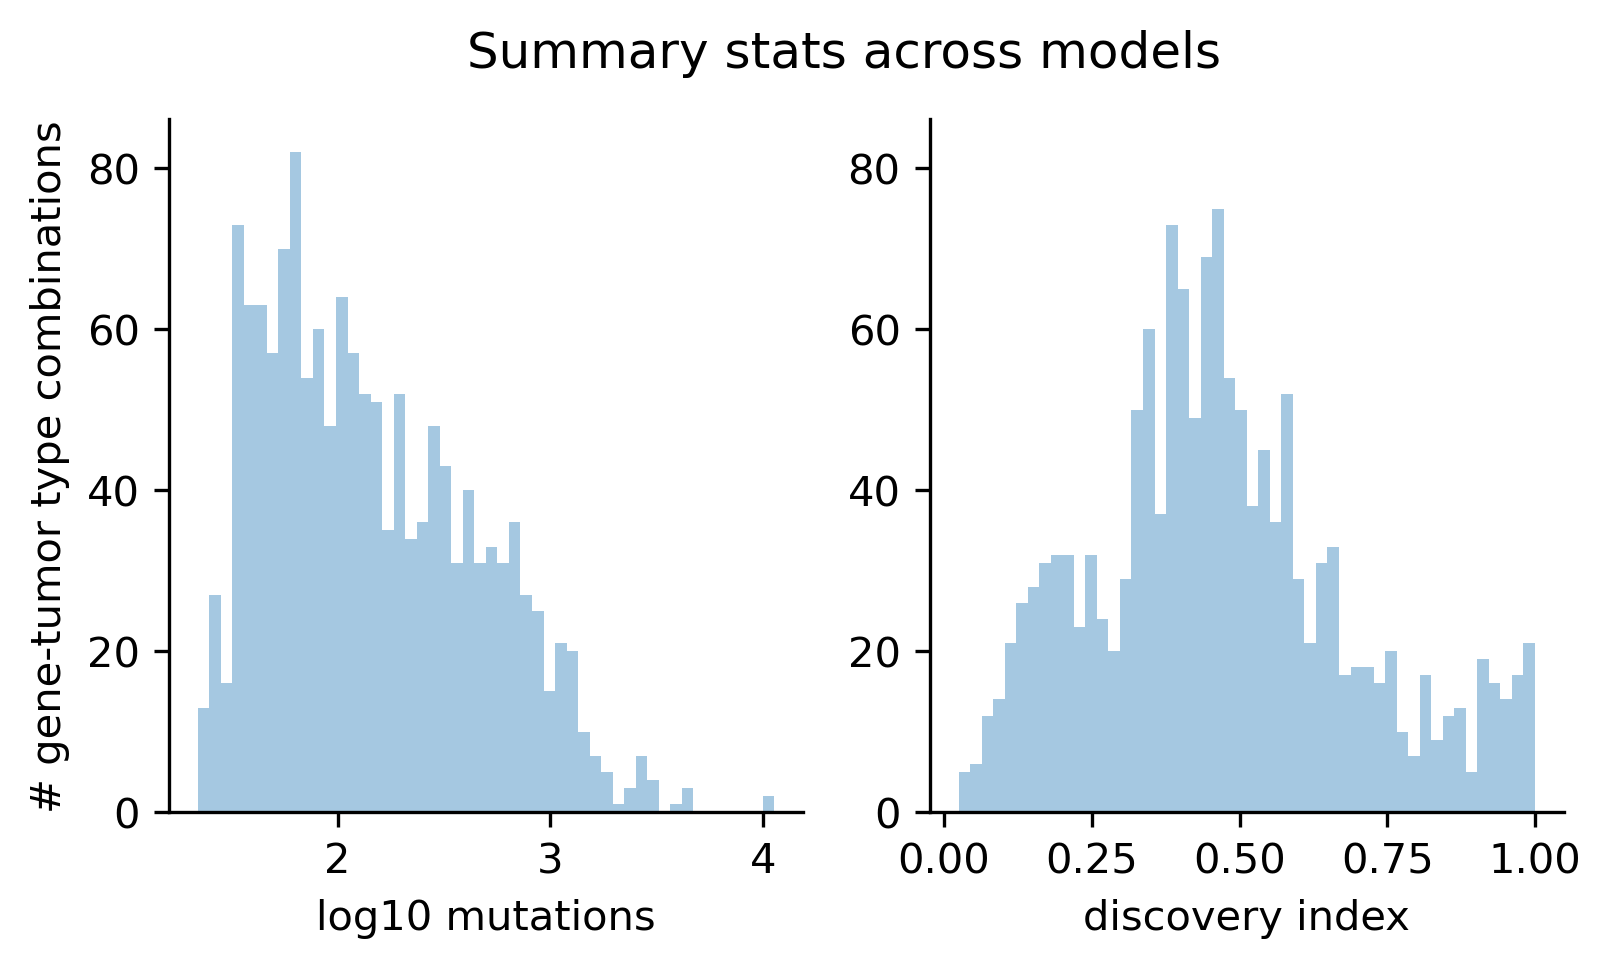
Using the catalog of observed mutations matching high dN/dS excess per consequence type and creating a catalog of synthetic mutations generated with the 96-trinucleotide context mutational profiles reflecting neutral mutagenesis, we can then conduct our supervised learning approach to train boostDM models.
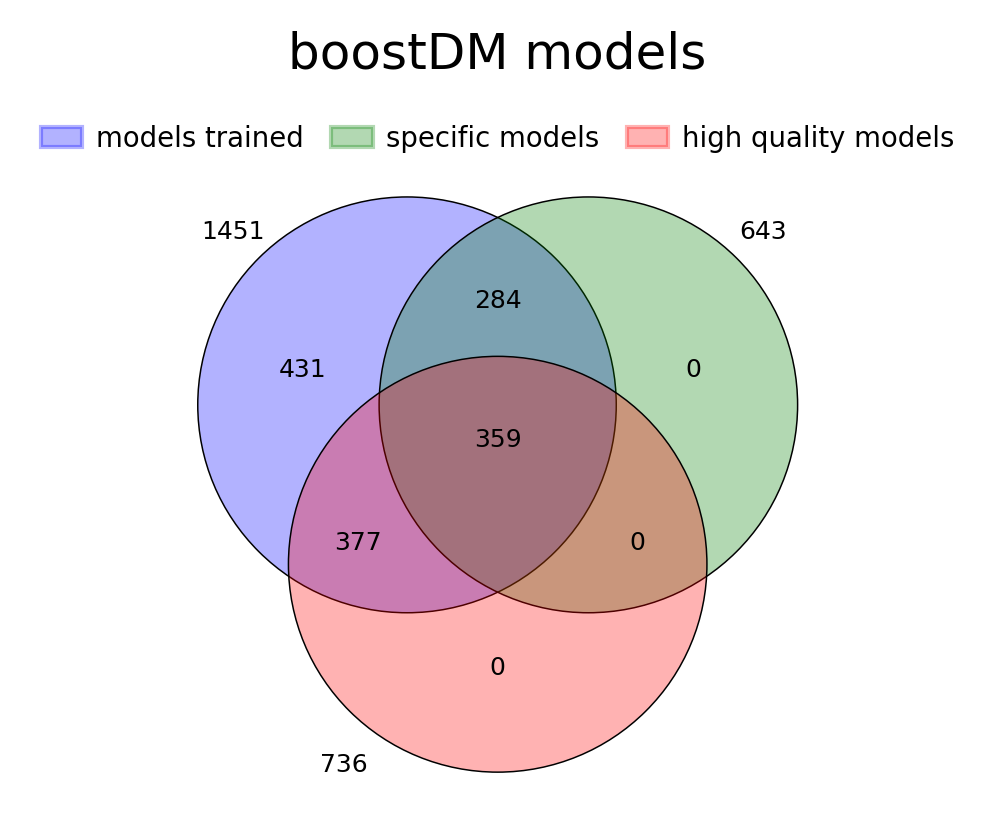
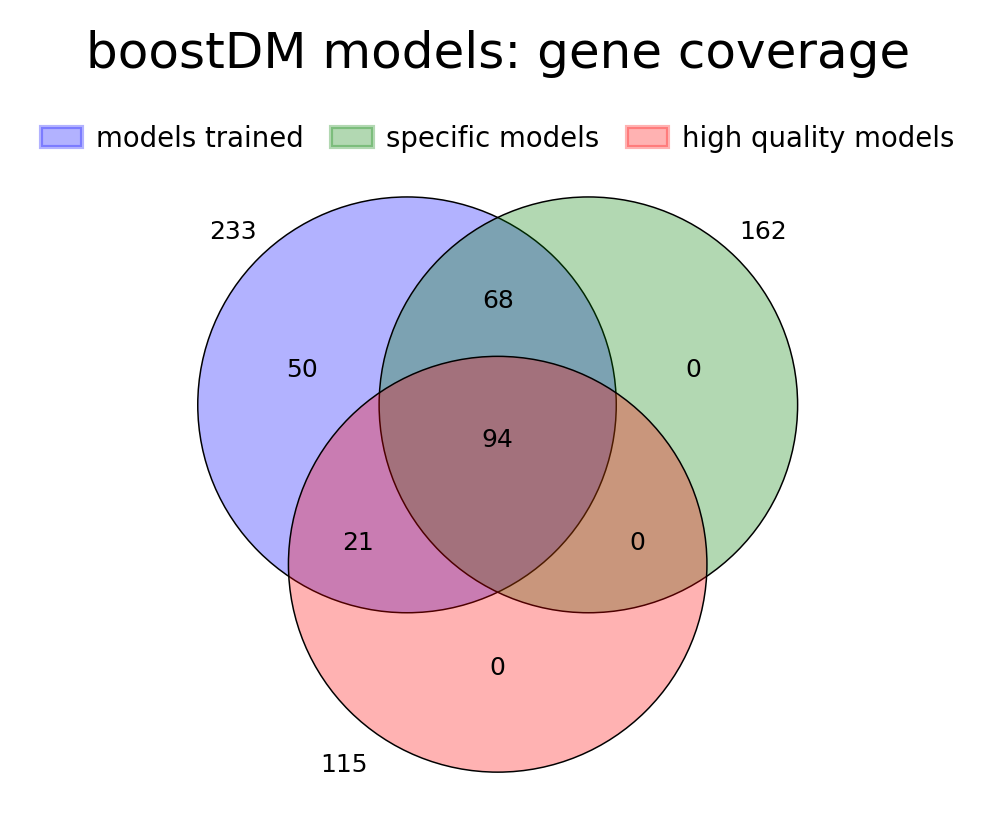
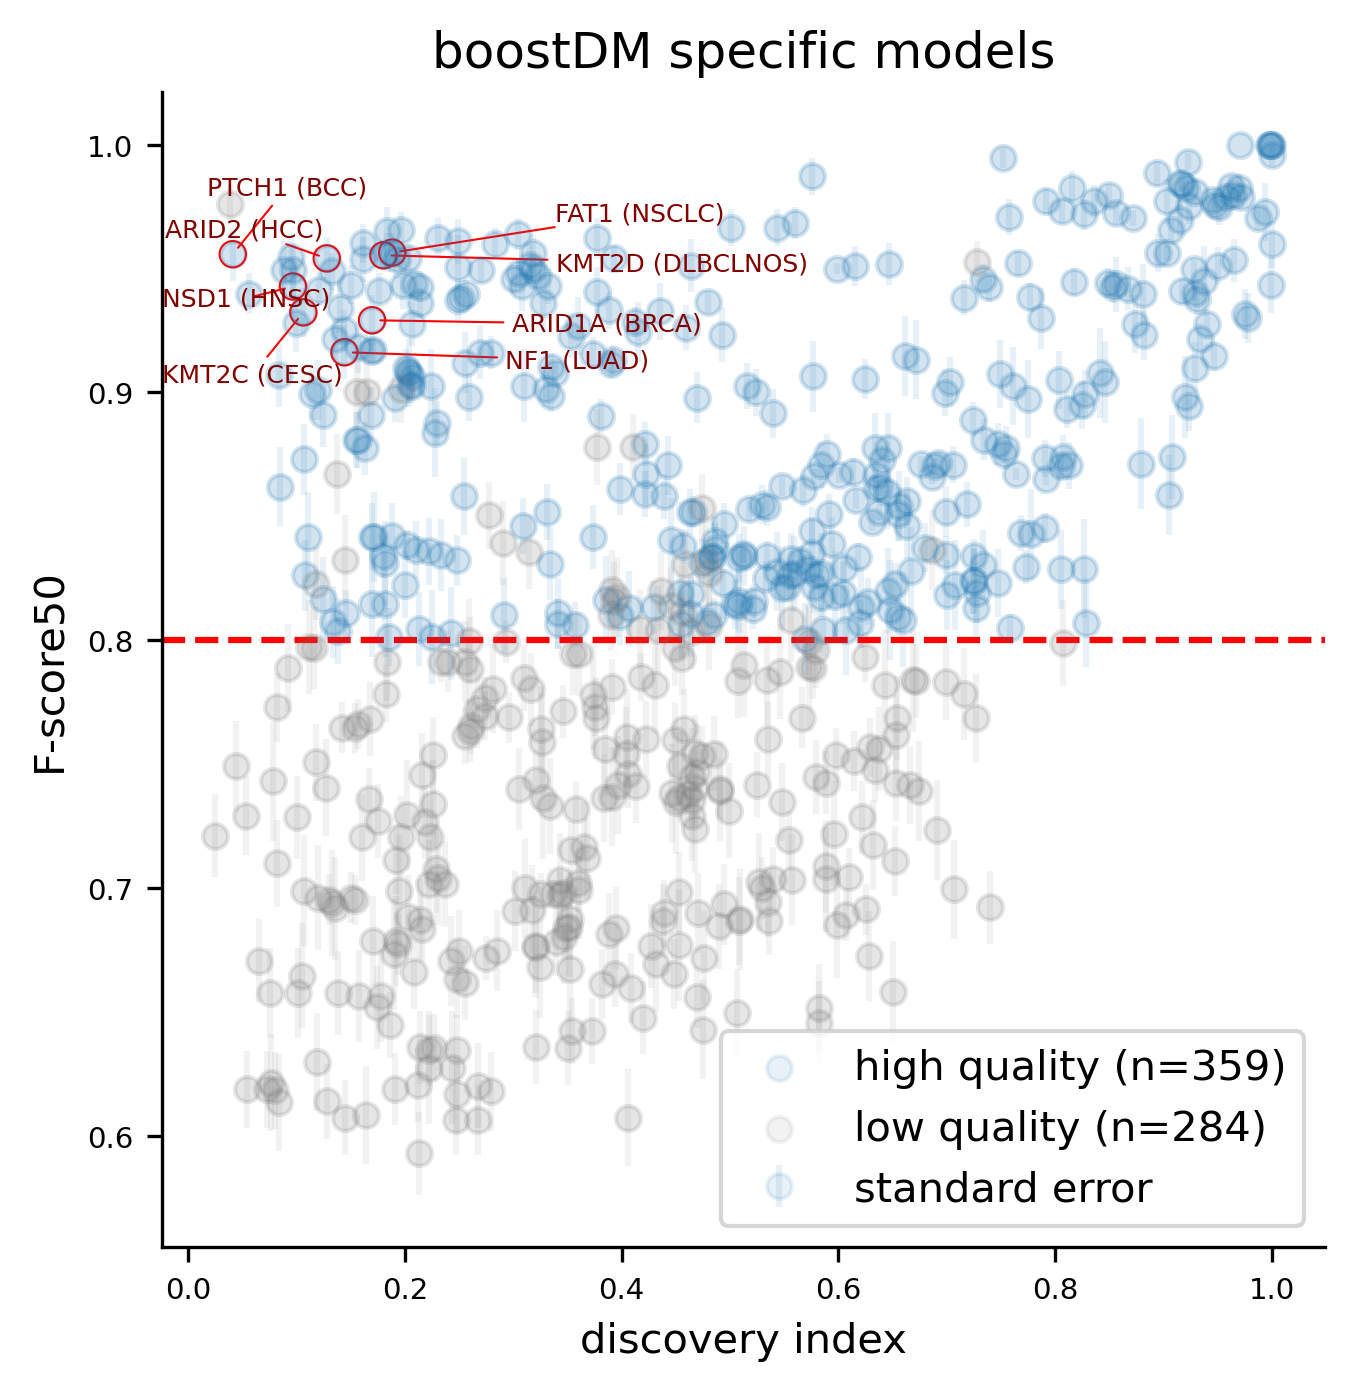
For this release, we trained 1,451 models for distinct driver gene and tumor type combinations, of which 643 are models at the finest level of tumor type specificity that we can afford with the cancer type annotation of our input cohorts of tumors. Applying our model selection criteria based on cross-validation (CV), the discovery index and the number of mutations observed, only 736 of the models trained meet the minimum qualification in terms of inductive bias and representativeness of the training set (hereinafter “high-quality models”). There are 359 high-quality models with highest level of tumor type specificity (hereinafter “specific models”).
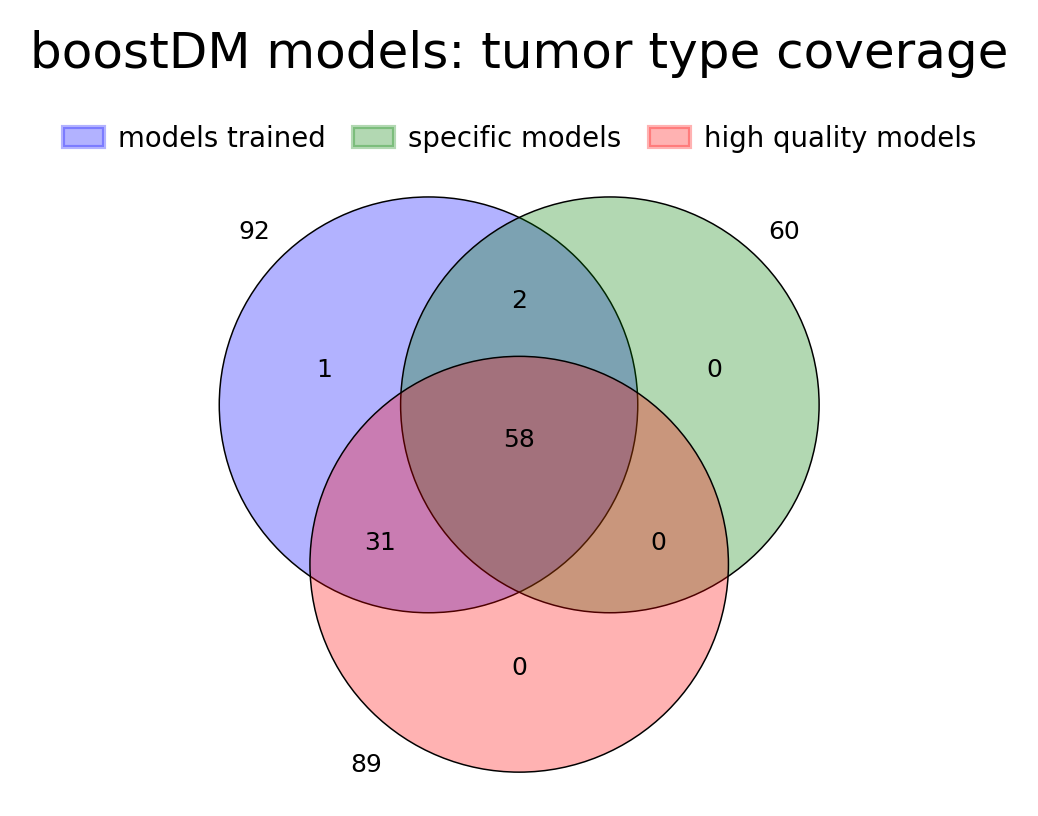
In terms of driver gene coverage, the high-quality models span 115 genes, with 94 represented in specific models and 21 additional genes represented by more general models (Figure 3B). In terms of tumor type coverage, the high-quality models span 89 tumor types, of which 58 are tumor types at the highest level of specificity (Figure 3C).

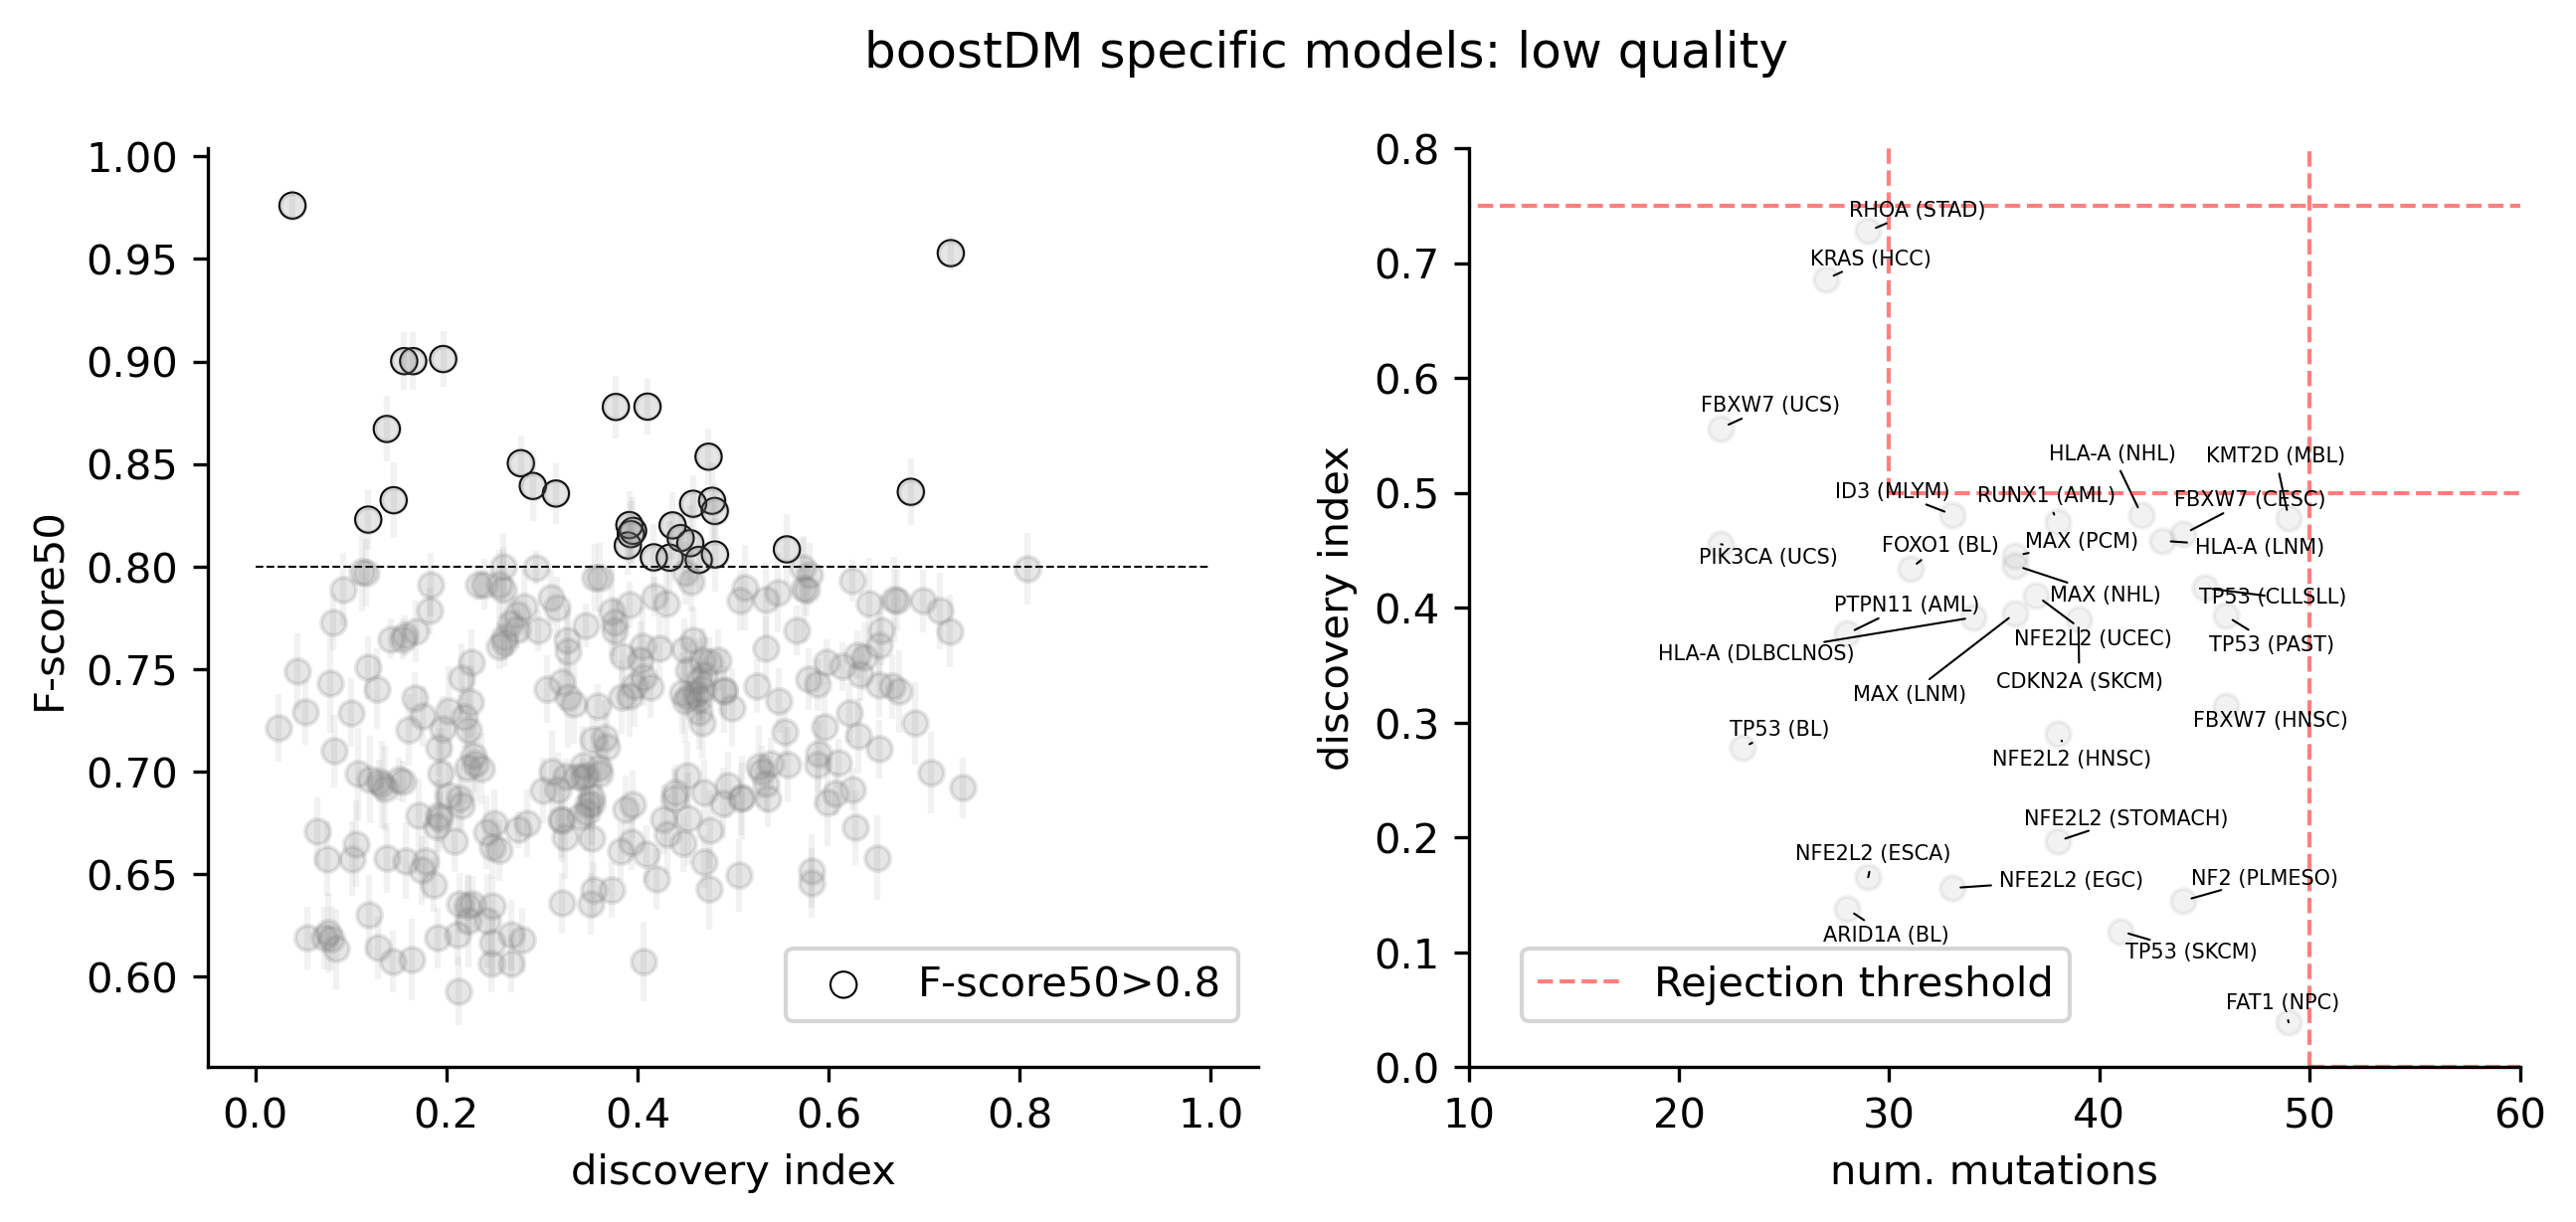
Cross-validation (CV) performance plays an important role in our model selection criteria. As in the previous release, the CV performance was reported with the so-called F-score50 (F-beta score with beta=0.5, thus giving more weight to precision). CV performances showed a remarkable concordance with the discovery index.
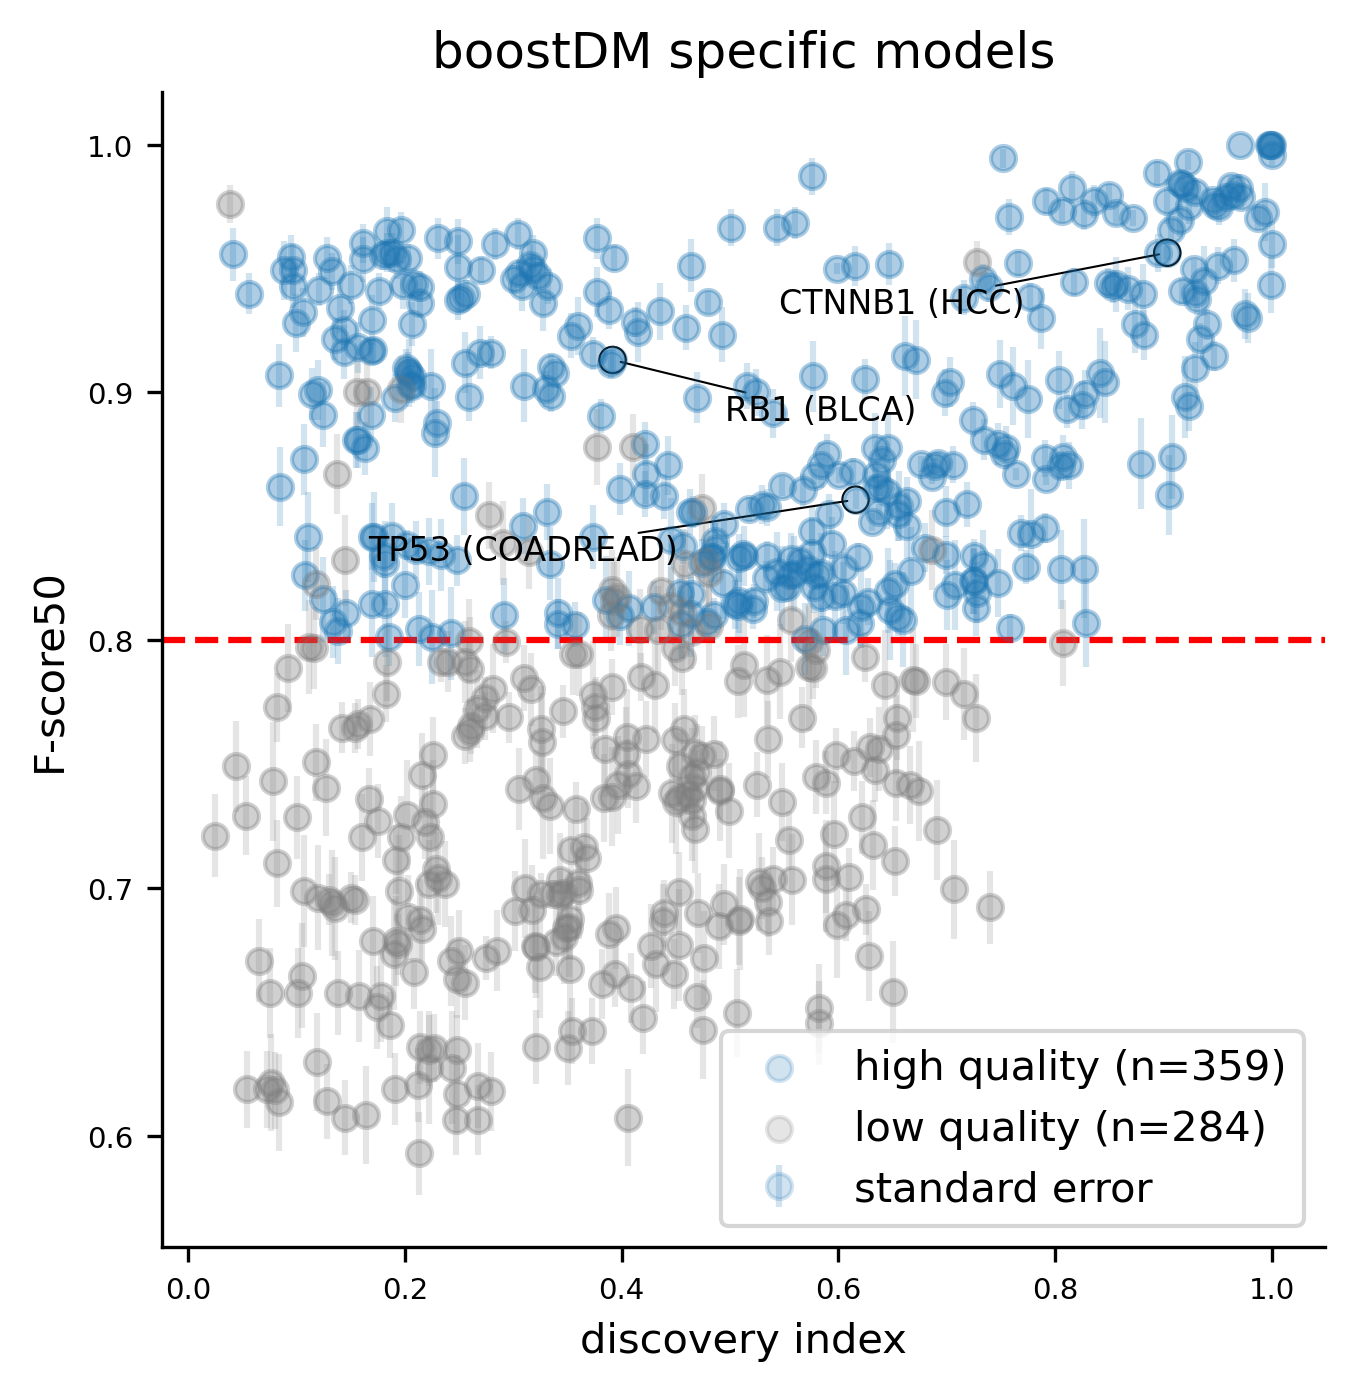
A few high-quality models are an exception to this general trend, whereby low values of the discovery index match a high CV performance. The analysis of SHAP feature explanations shows that these models are predominantly driven by the consequence type of the mutations: these are very simple models that accurately discriminate between positive and negative examples for which the set of observed mutations is far from saturation. These models have learned very simple although effective classification rules (e.g. any truncating mutation being a driver) in a context where we still expect to find many more new mutations as more tumors get sequenced, whence the low discovery index.
Only 30 specific models above the minimum CV performance threshold are rejected because of their low number of observed mutations given their moderate/low discovery index value.
In this section we will denote v2021 the previous release of boostDM and v2024 the current release.
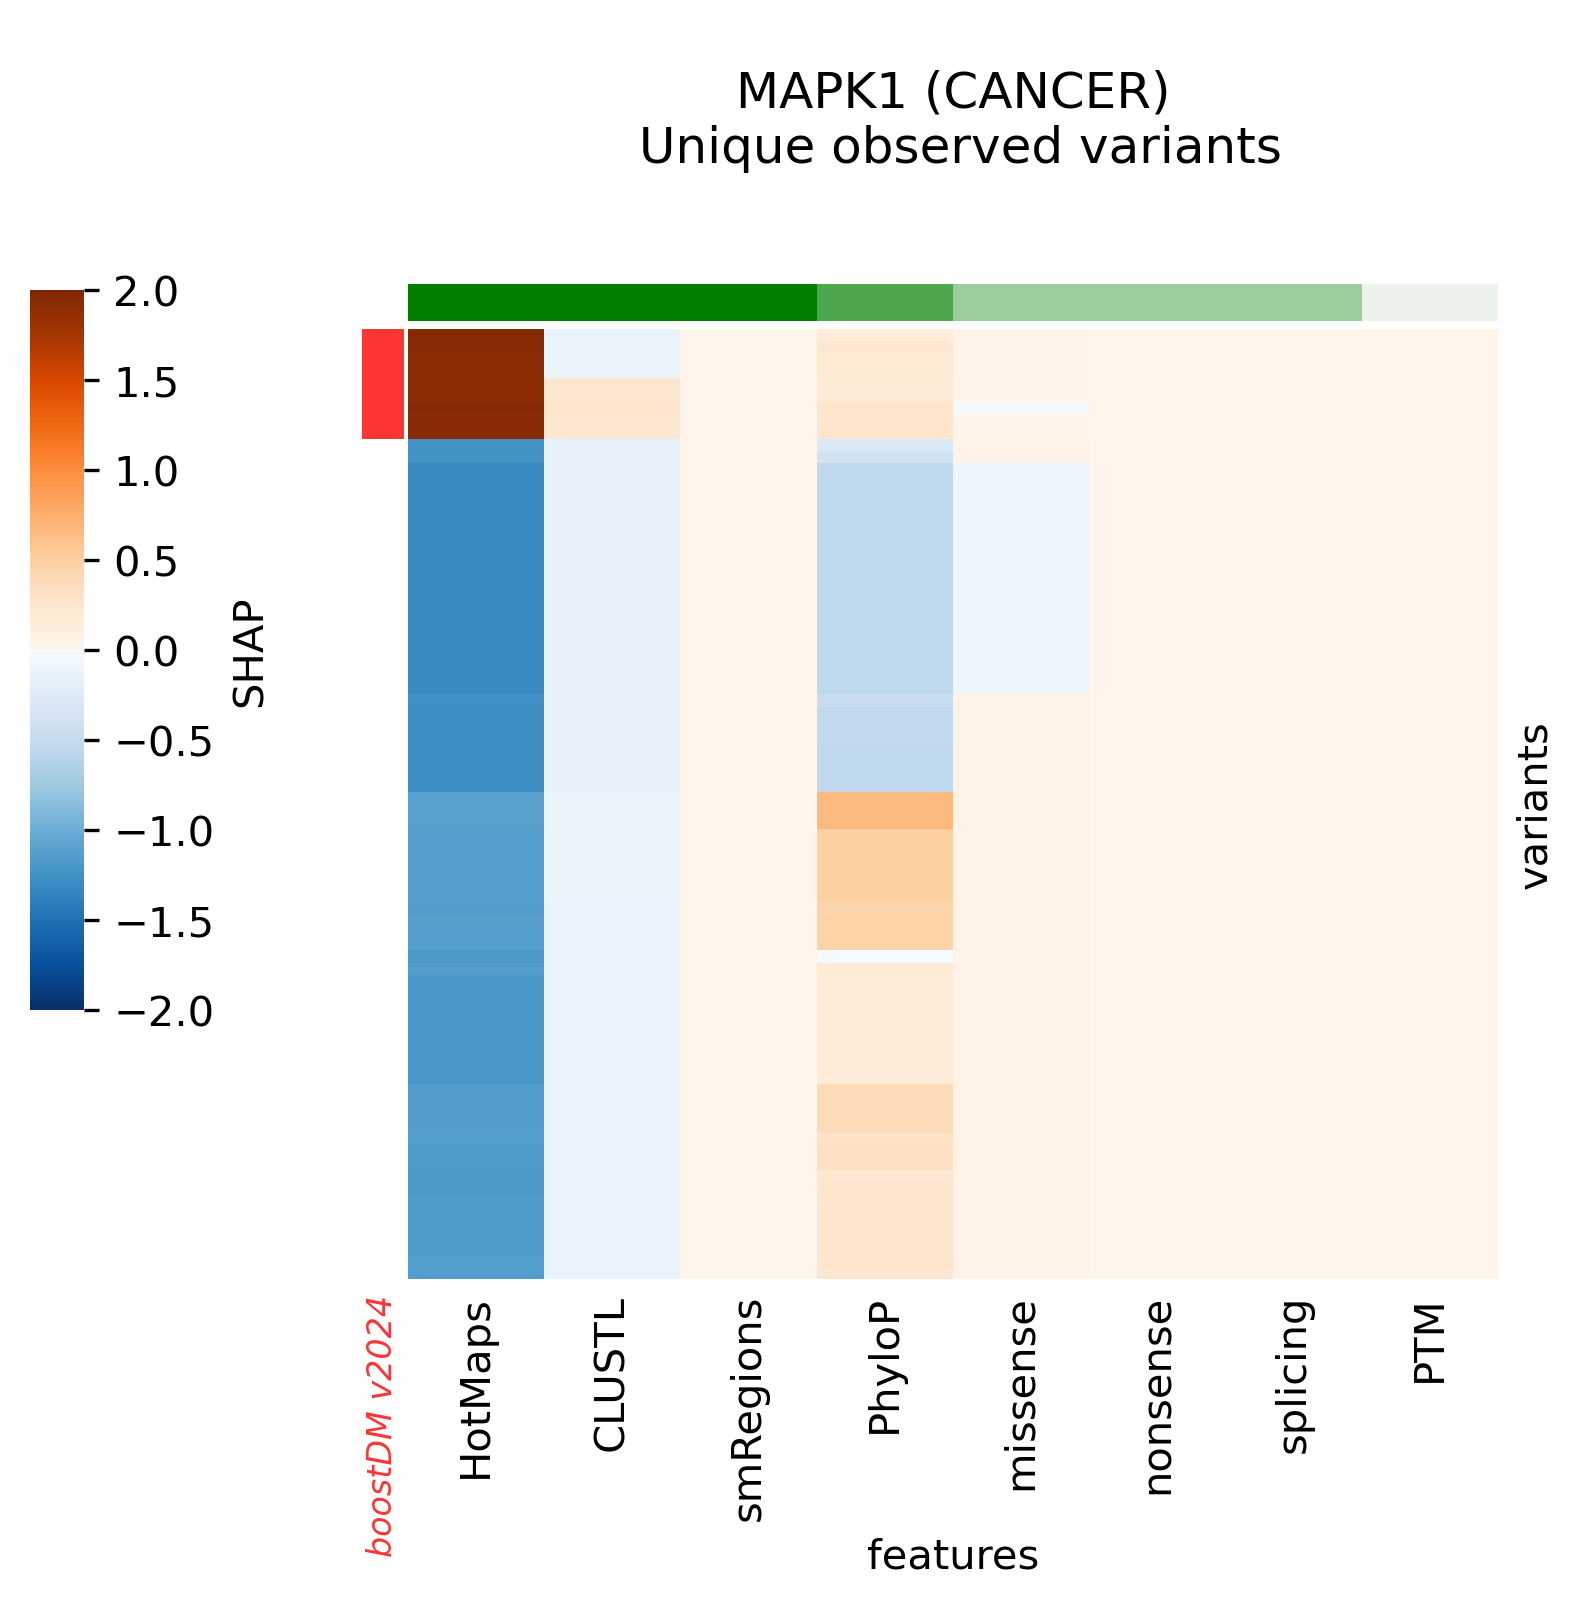
The current release v2024 includes models for 39 genes that previously did not have any high-quality models. The complete list of new genes is the following:
ARHGAP35, ATF7IP, BAP1, BCL7A, BCL9L, BCOR, BRCA1, BRCA2, BRD7, CCND3, CDKN1A, CNOT9, FGFR1, FGFR2, FOXO1, FUBP1, GNAS, ID3, MAPK1, MAX, MGA, MYCN, NF2, NFKBIA, NOTCH2, POU2F2, PTCH1, RASA1, RHPN2, RNF43, RXRA, SMO, SOX9, SPEN, STAT6, TSC2, USP6, WT1, XPO1
The user may note the inclusion of H3-3A among the genes with models. This gene was named H3F3A in Intogen v2024, thus neither the gene H3F3A has dropped nor the gene H3-3A is a new inclusion among the high-quality models.
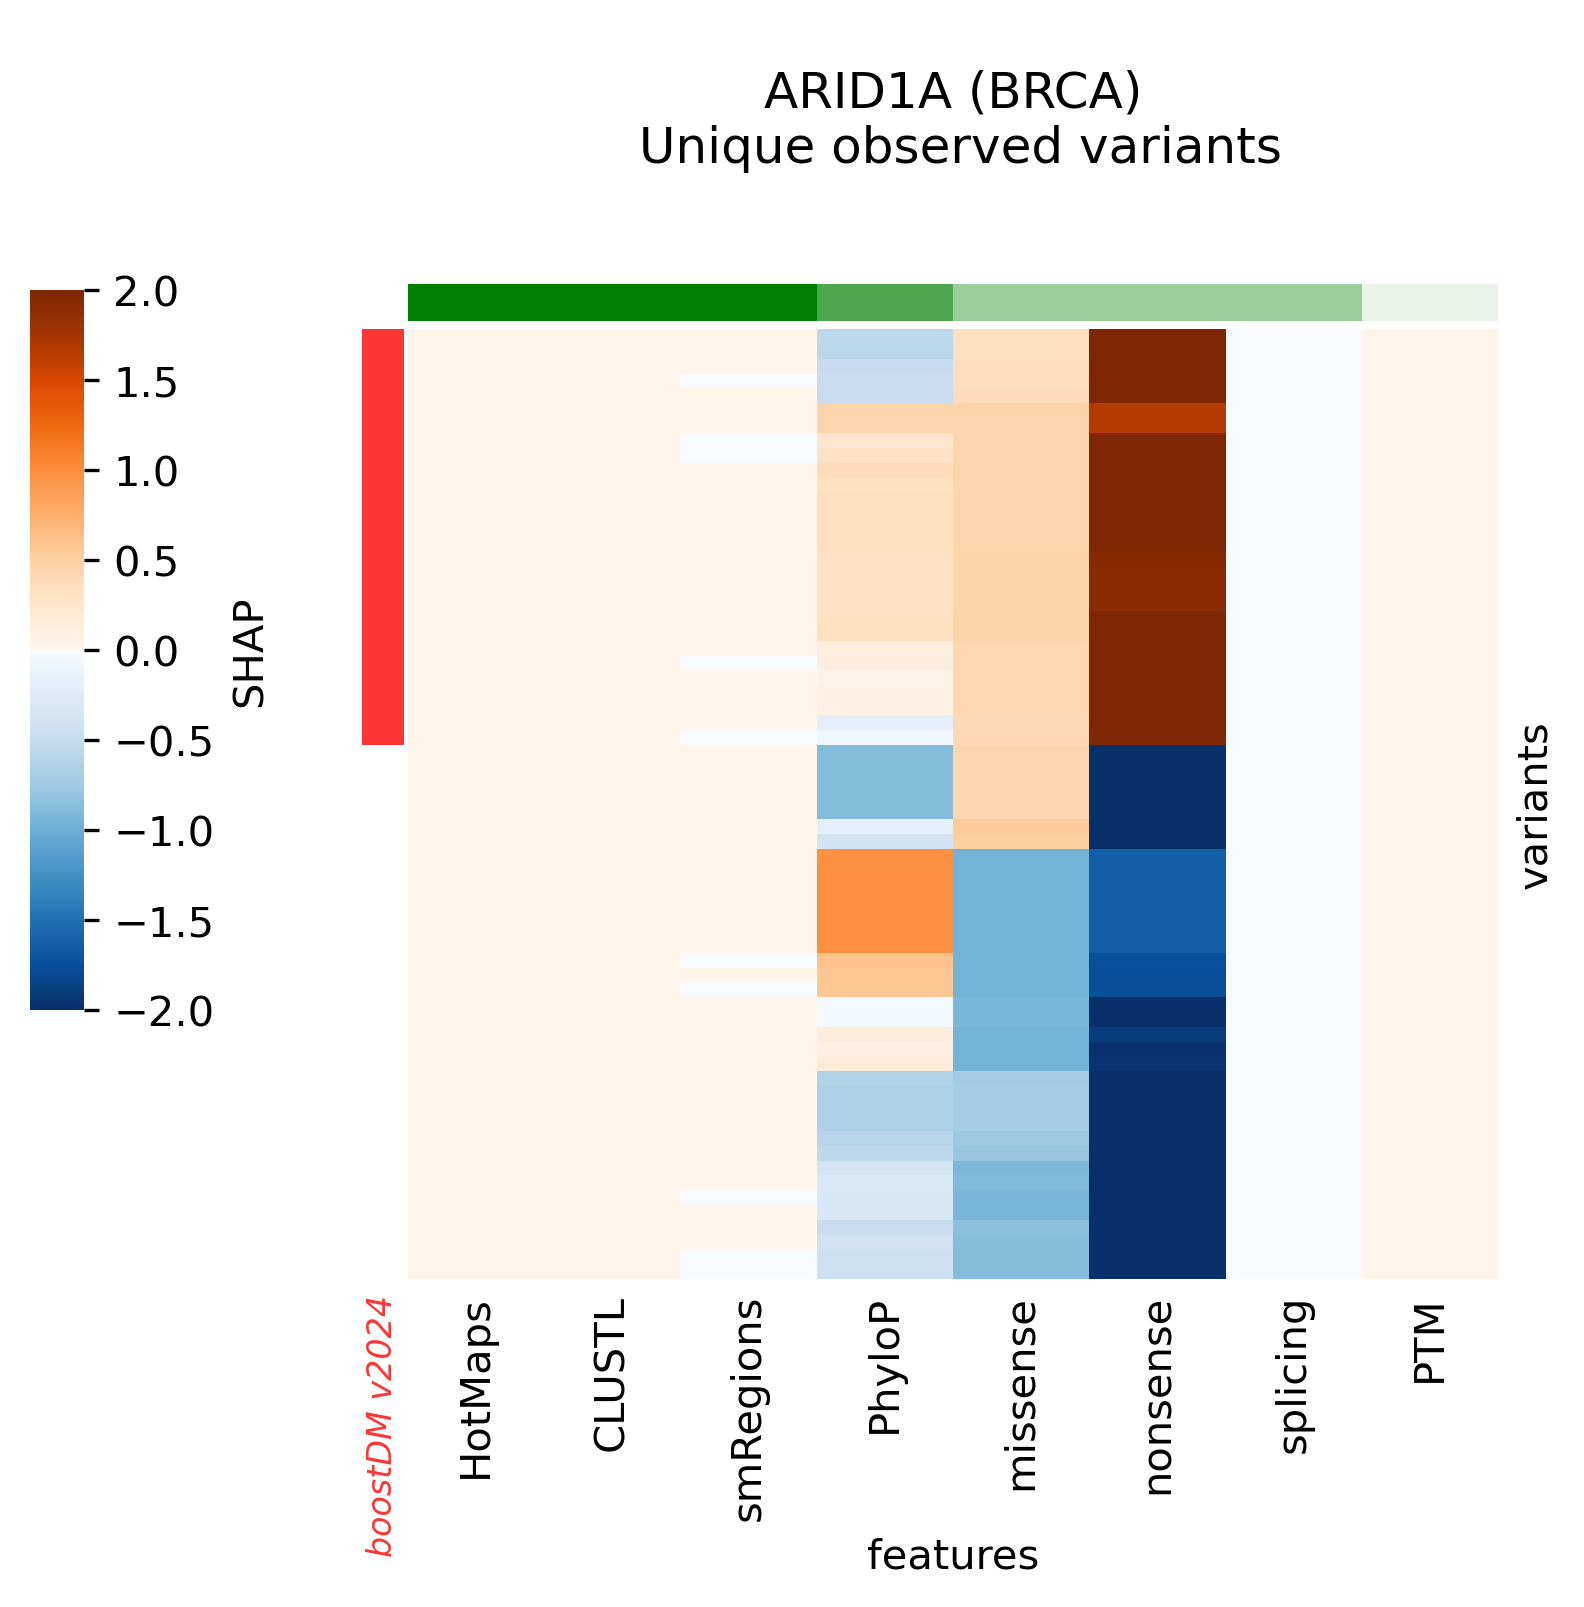
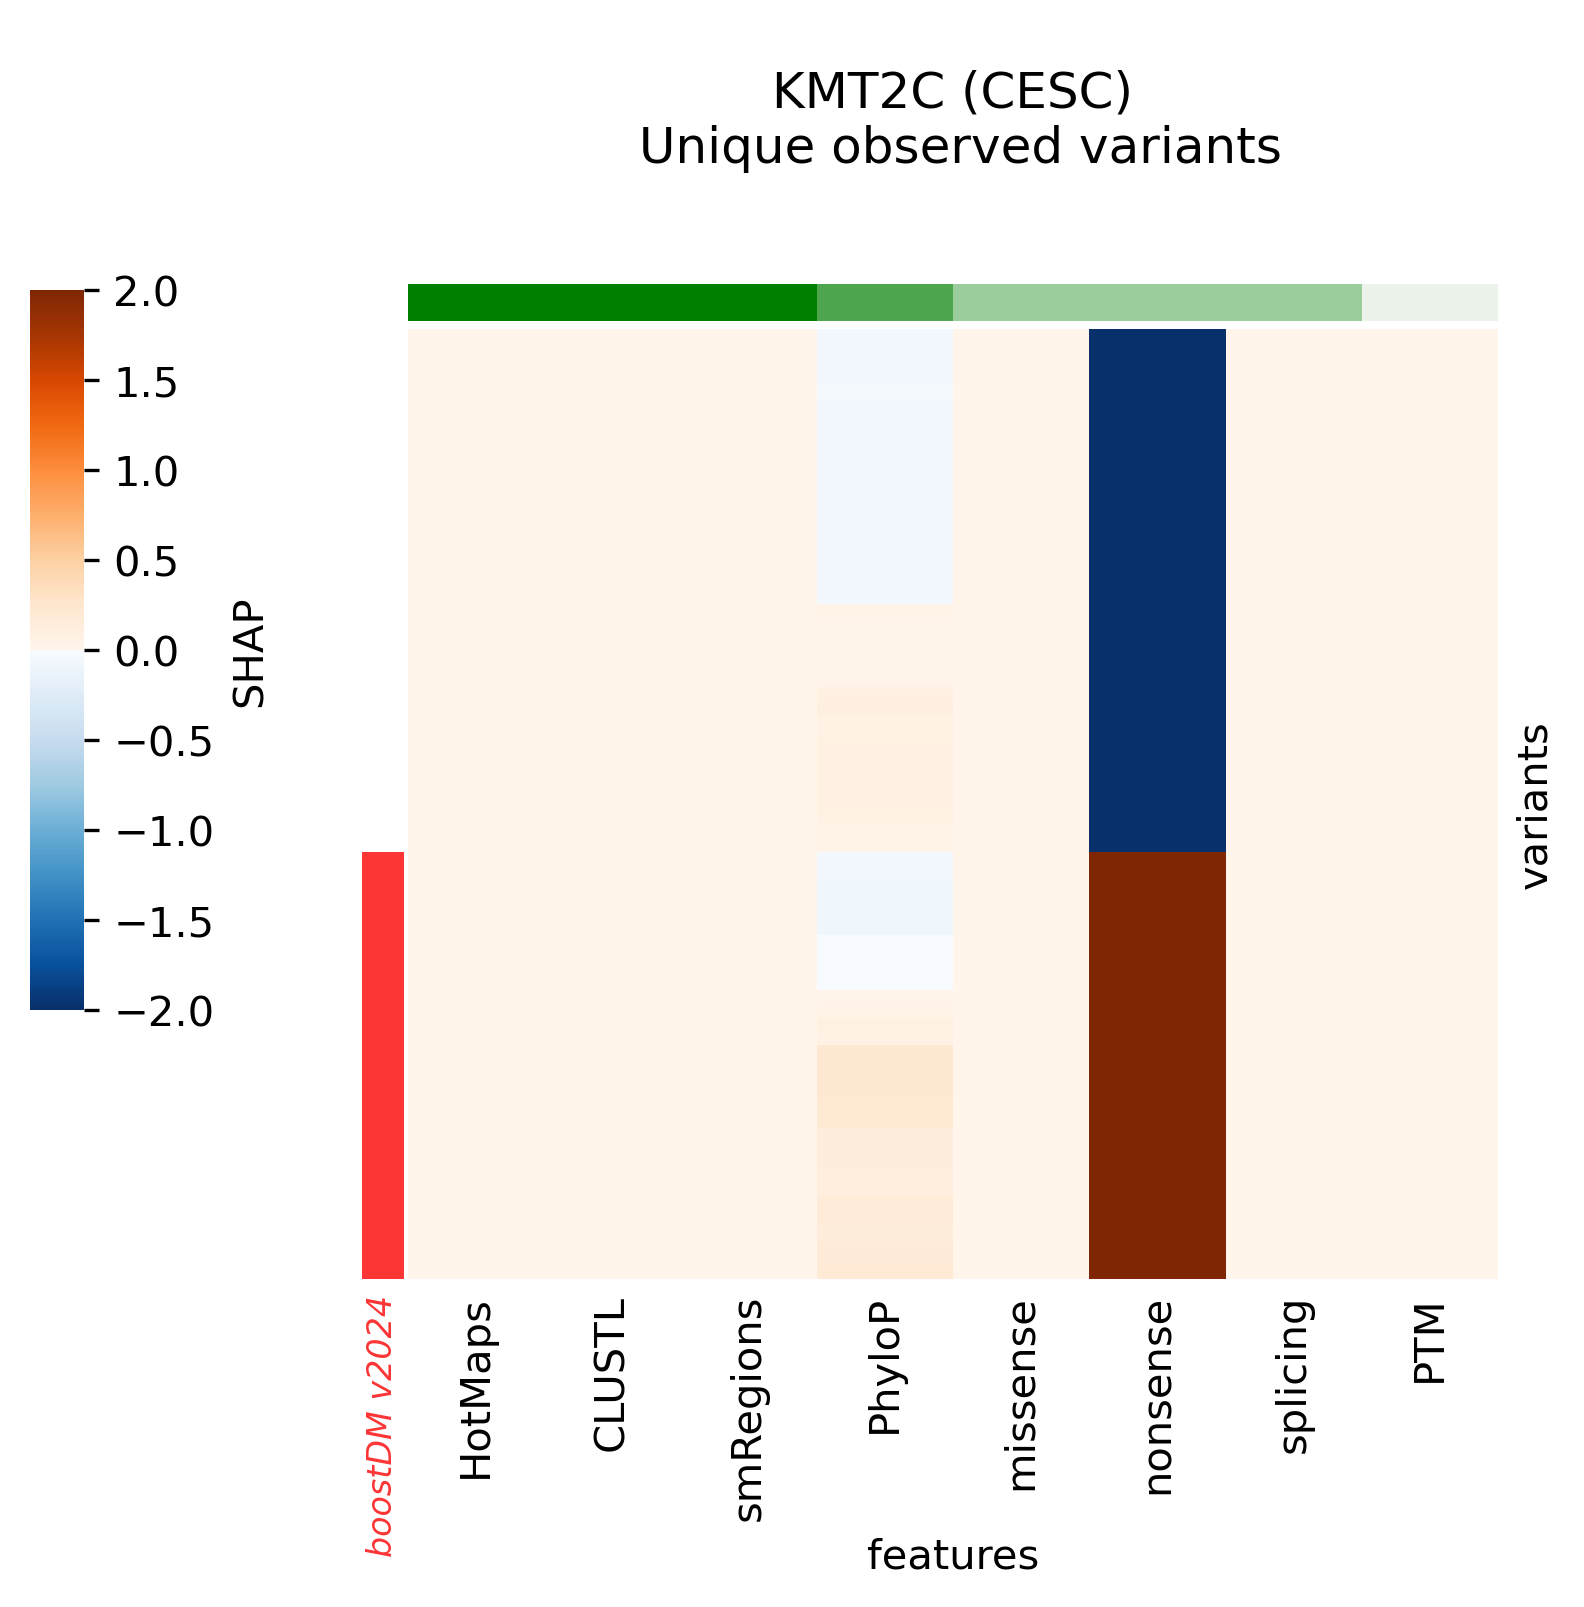
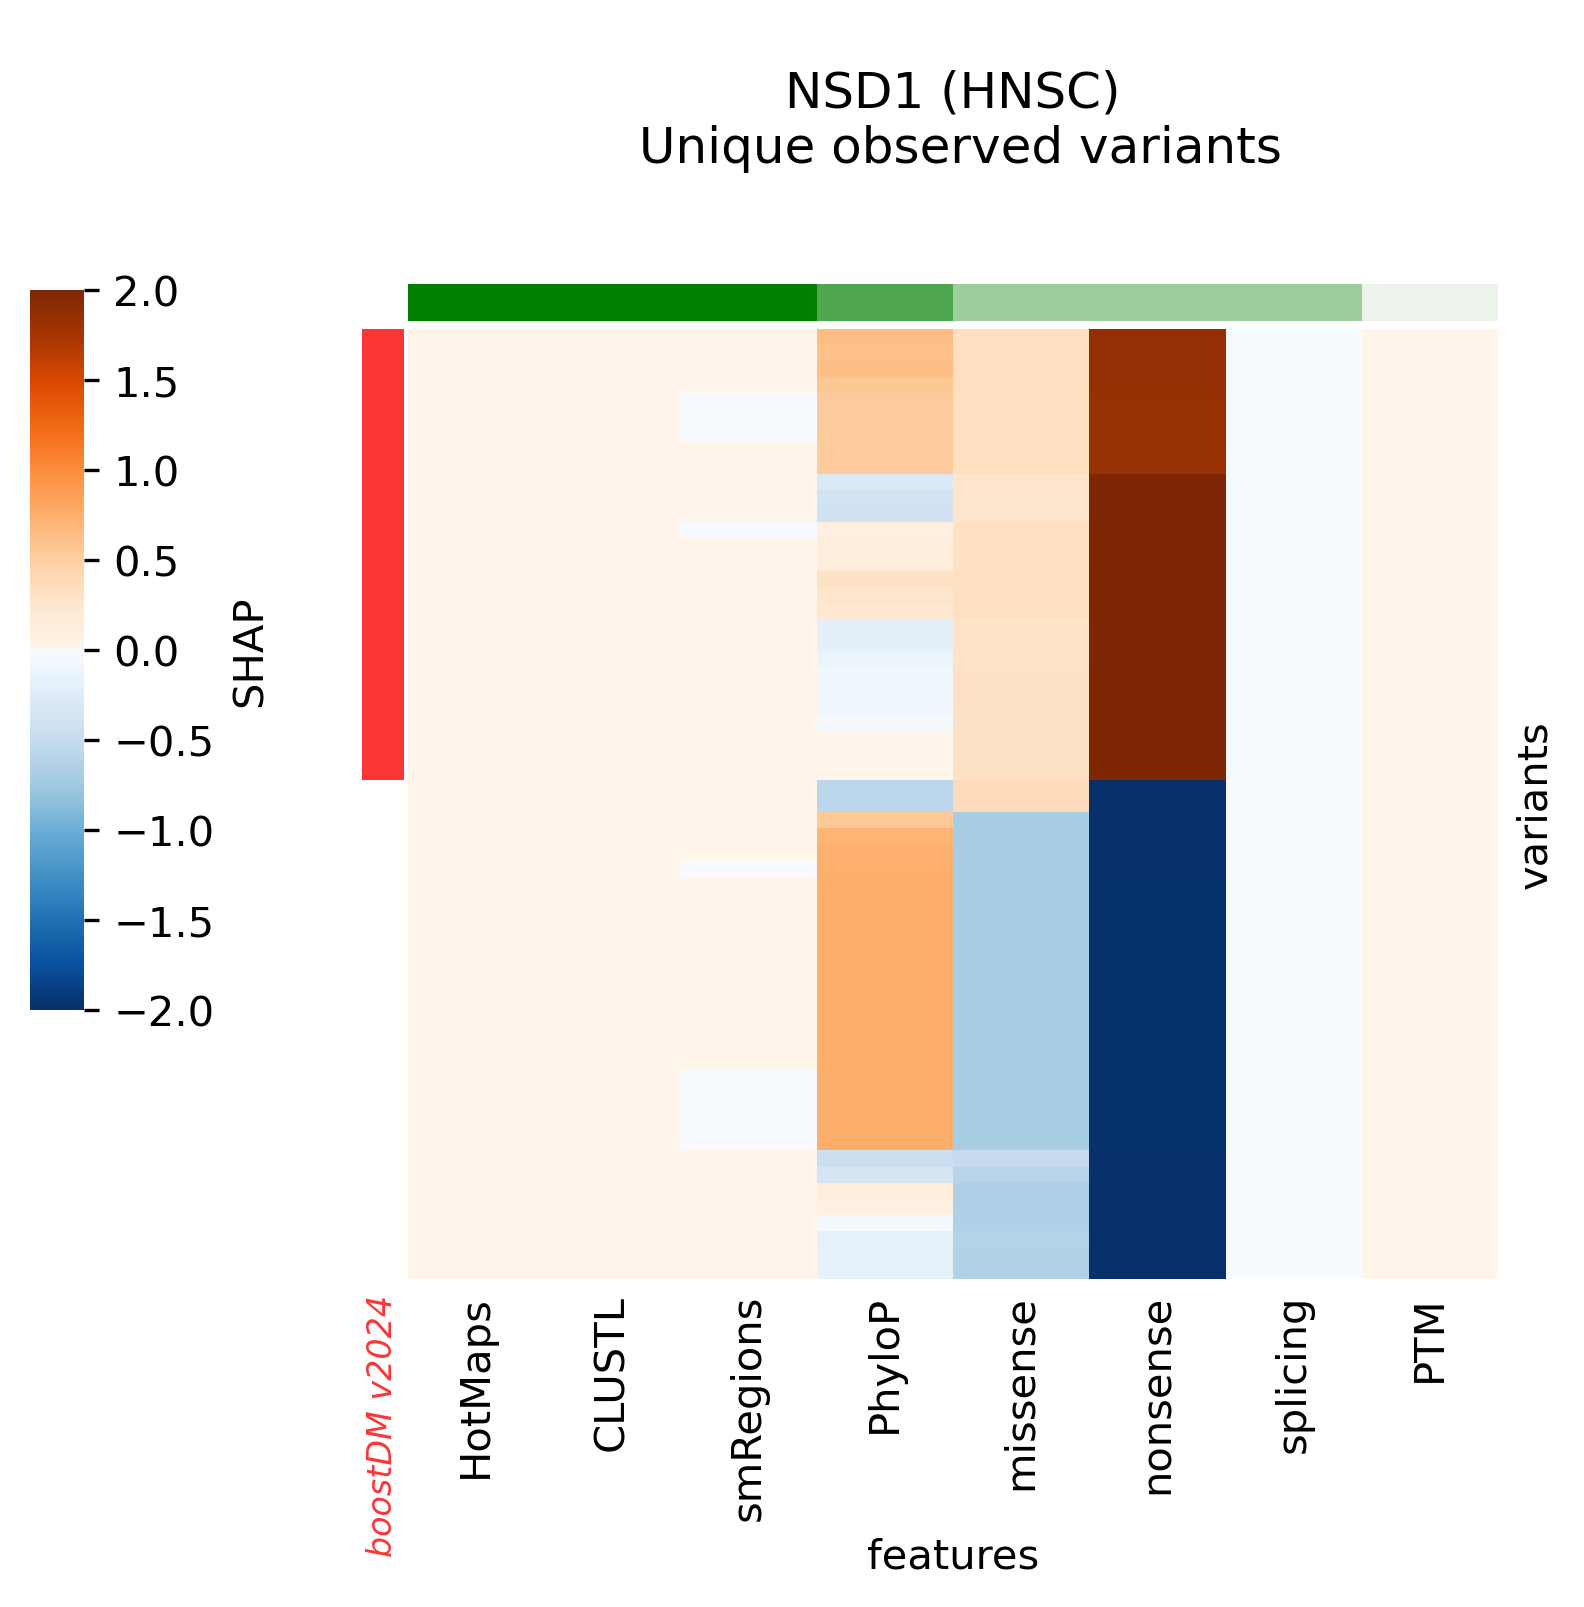
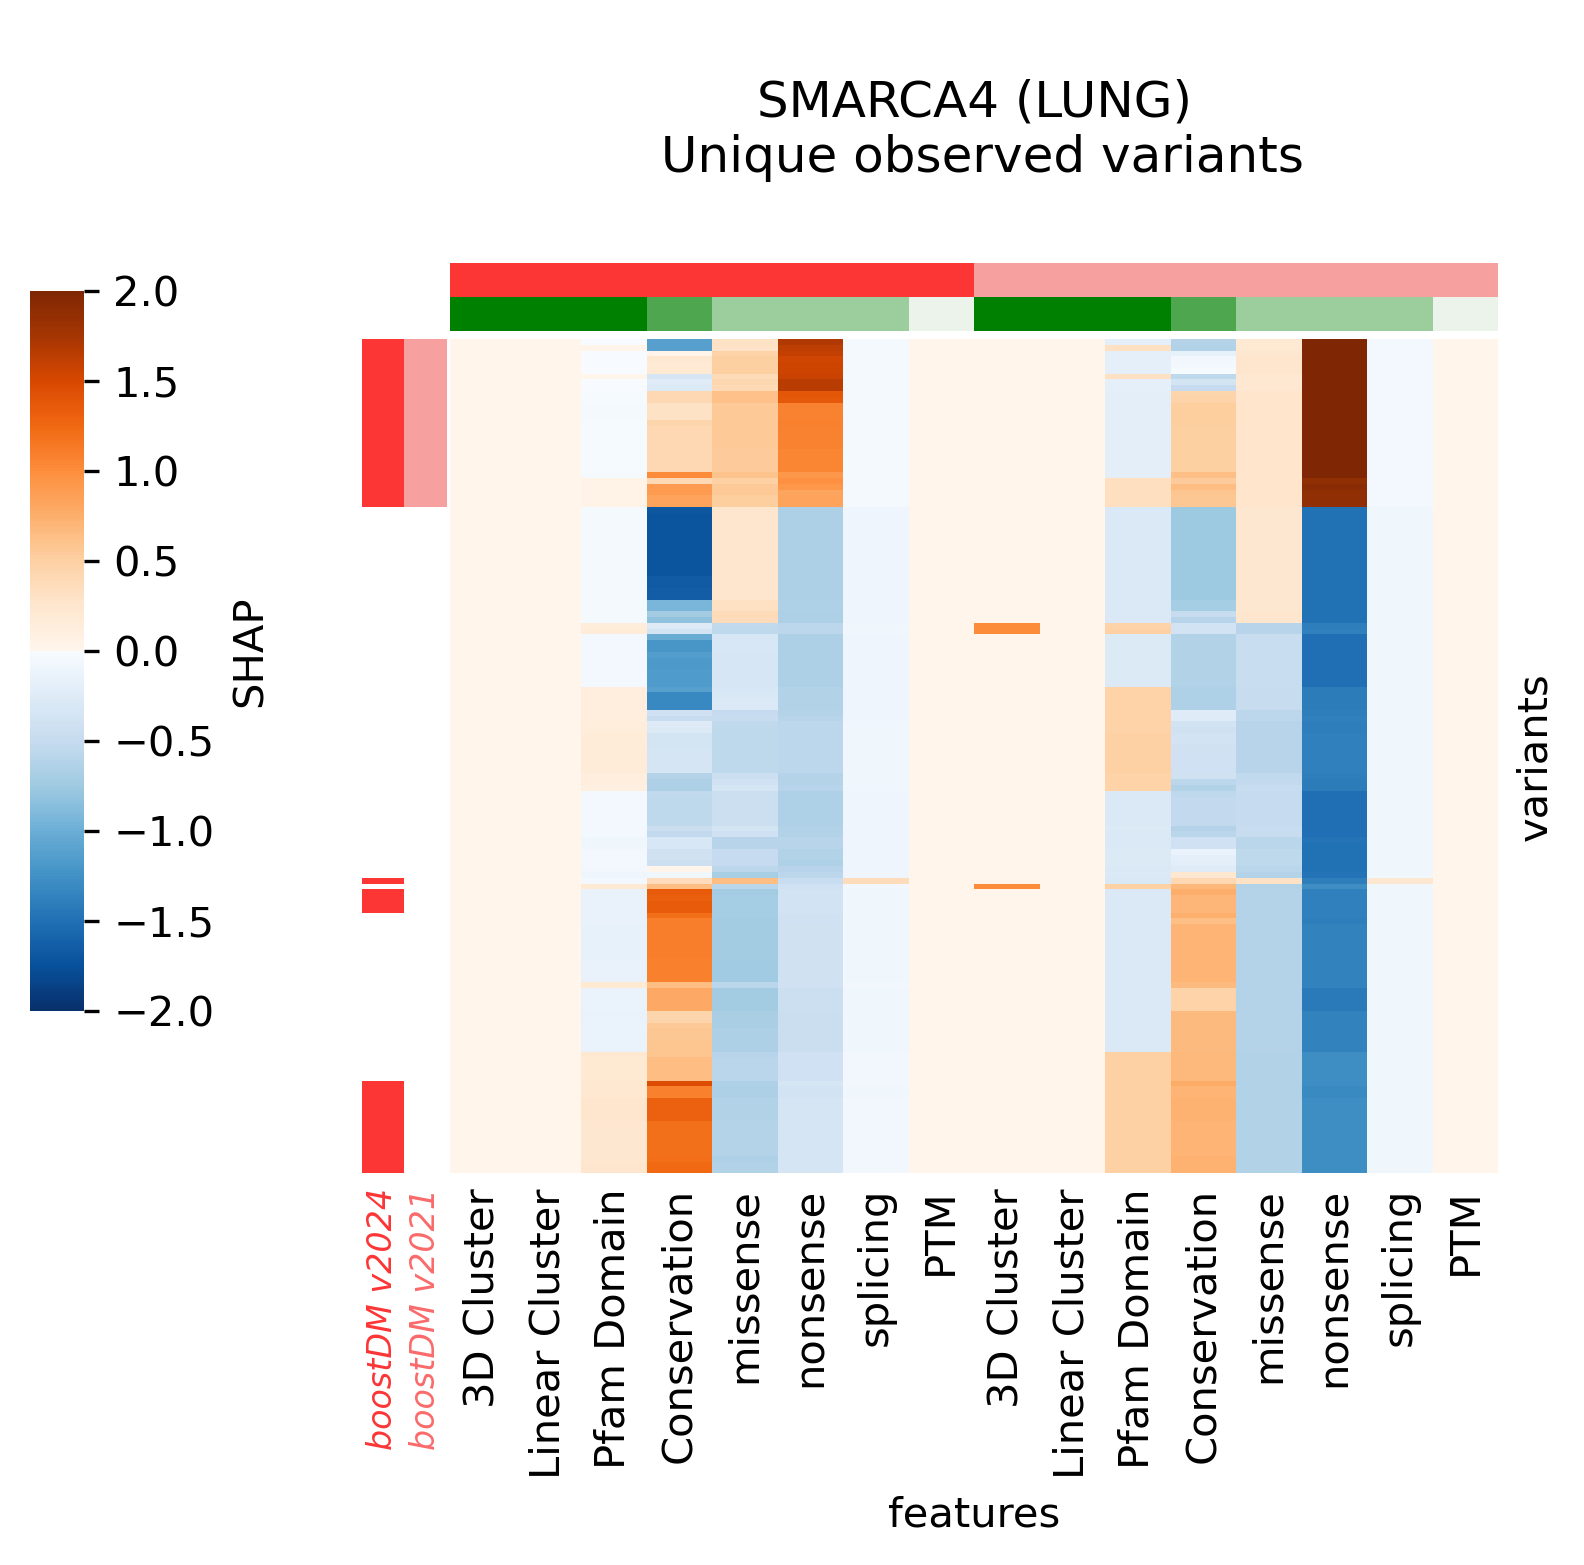
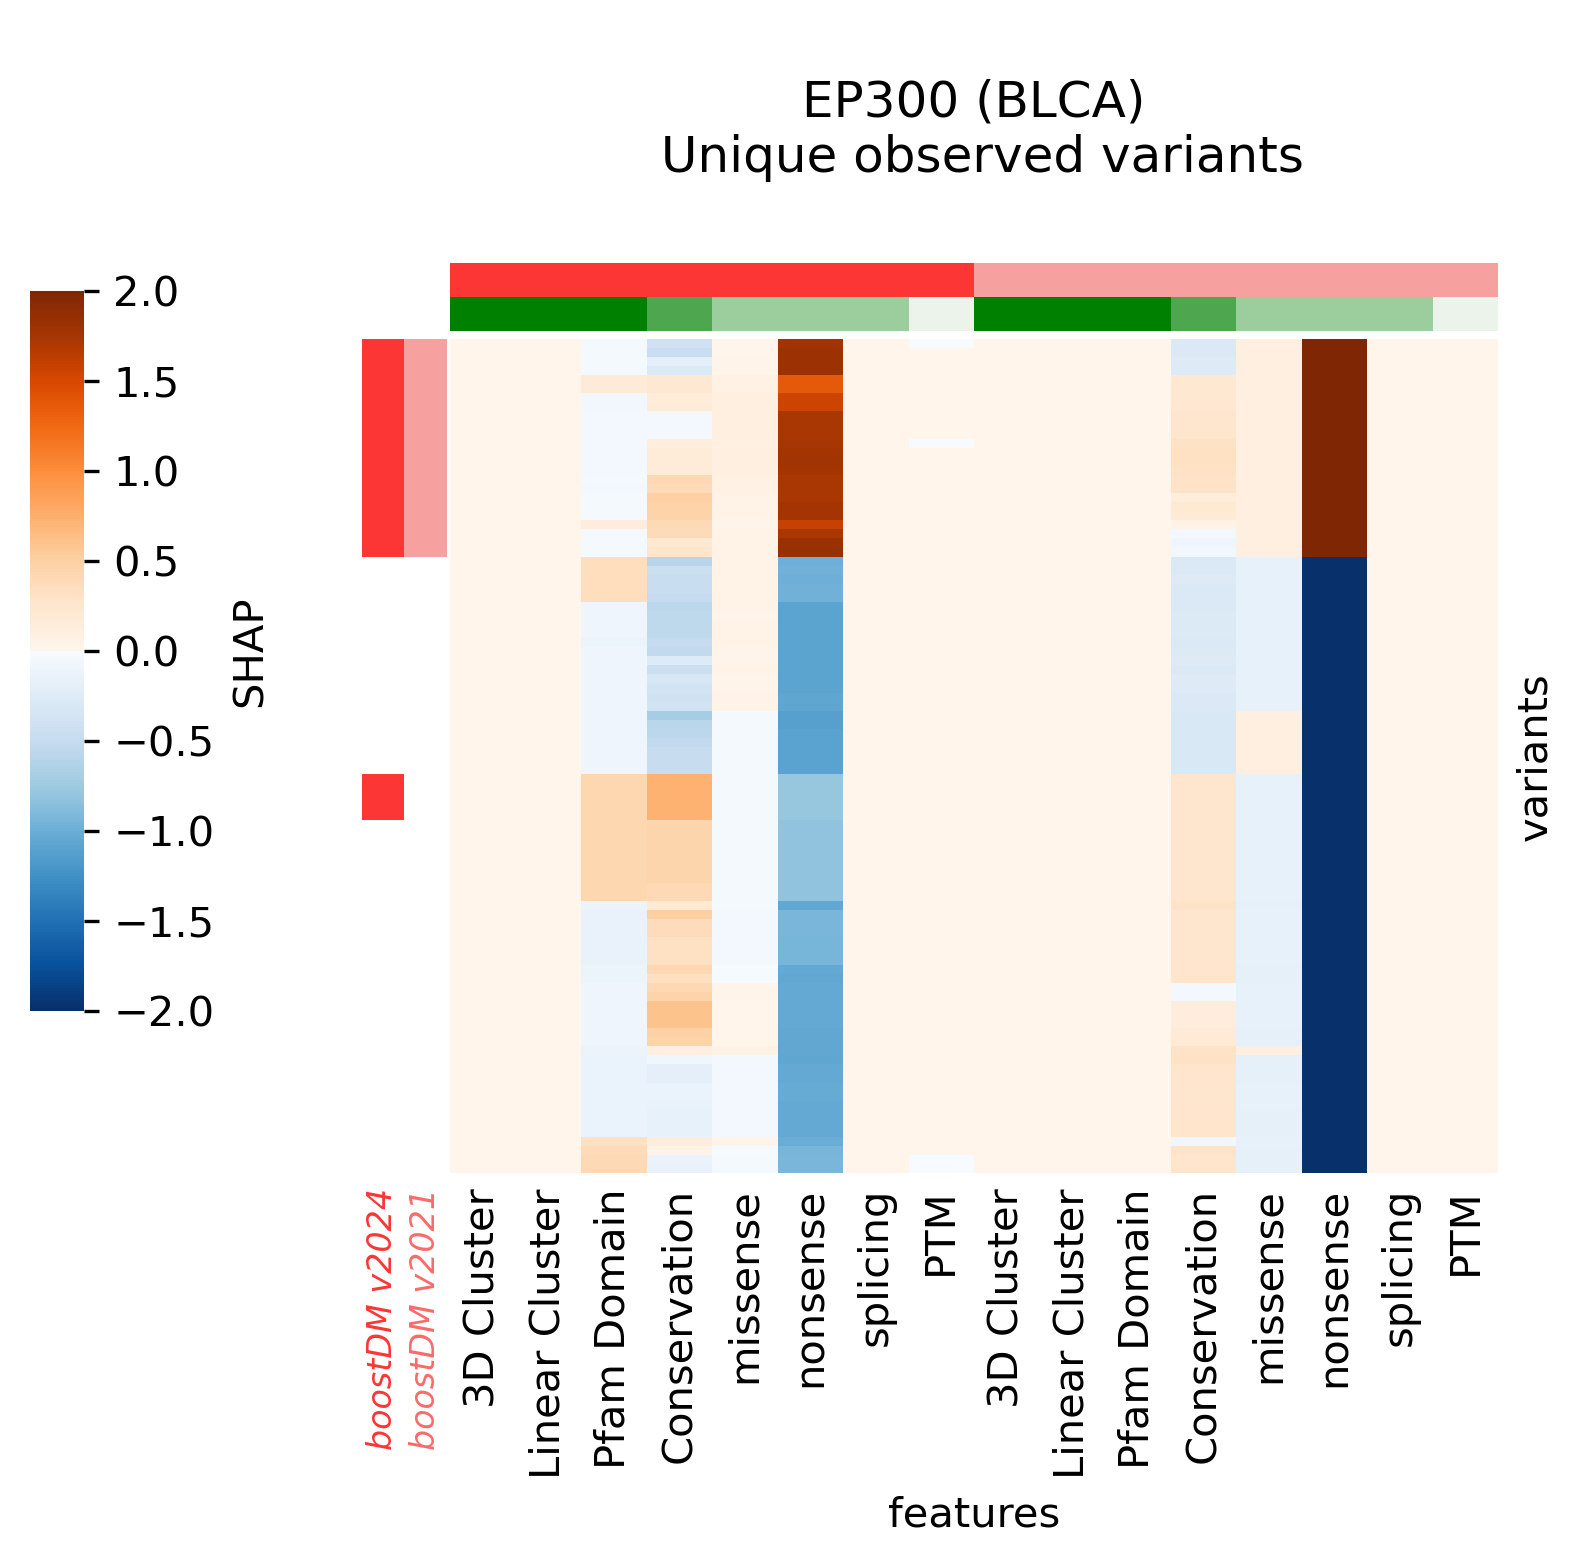
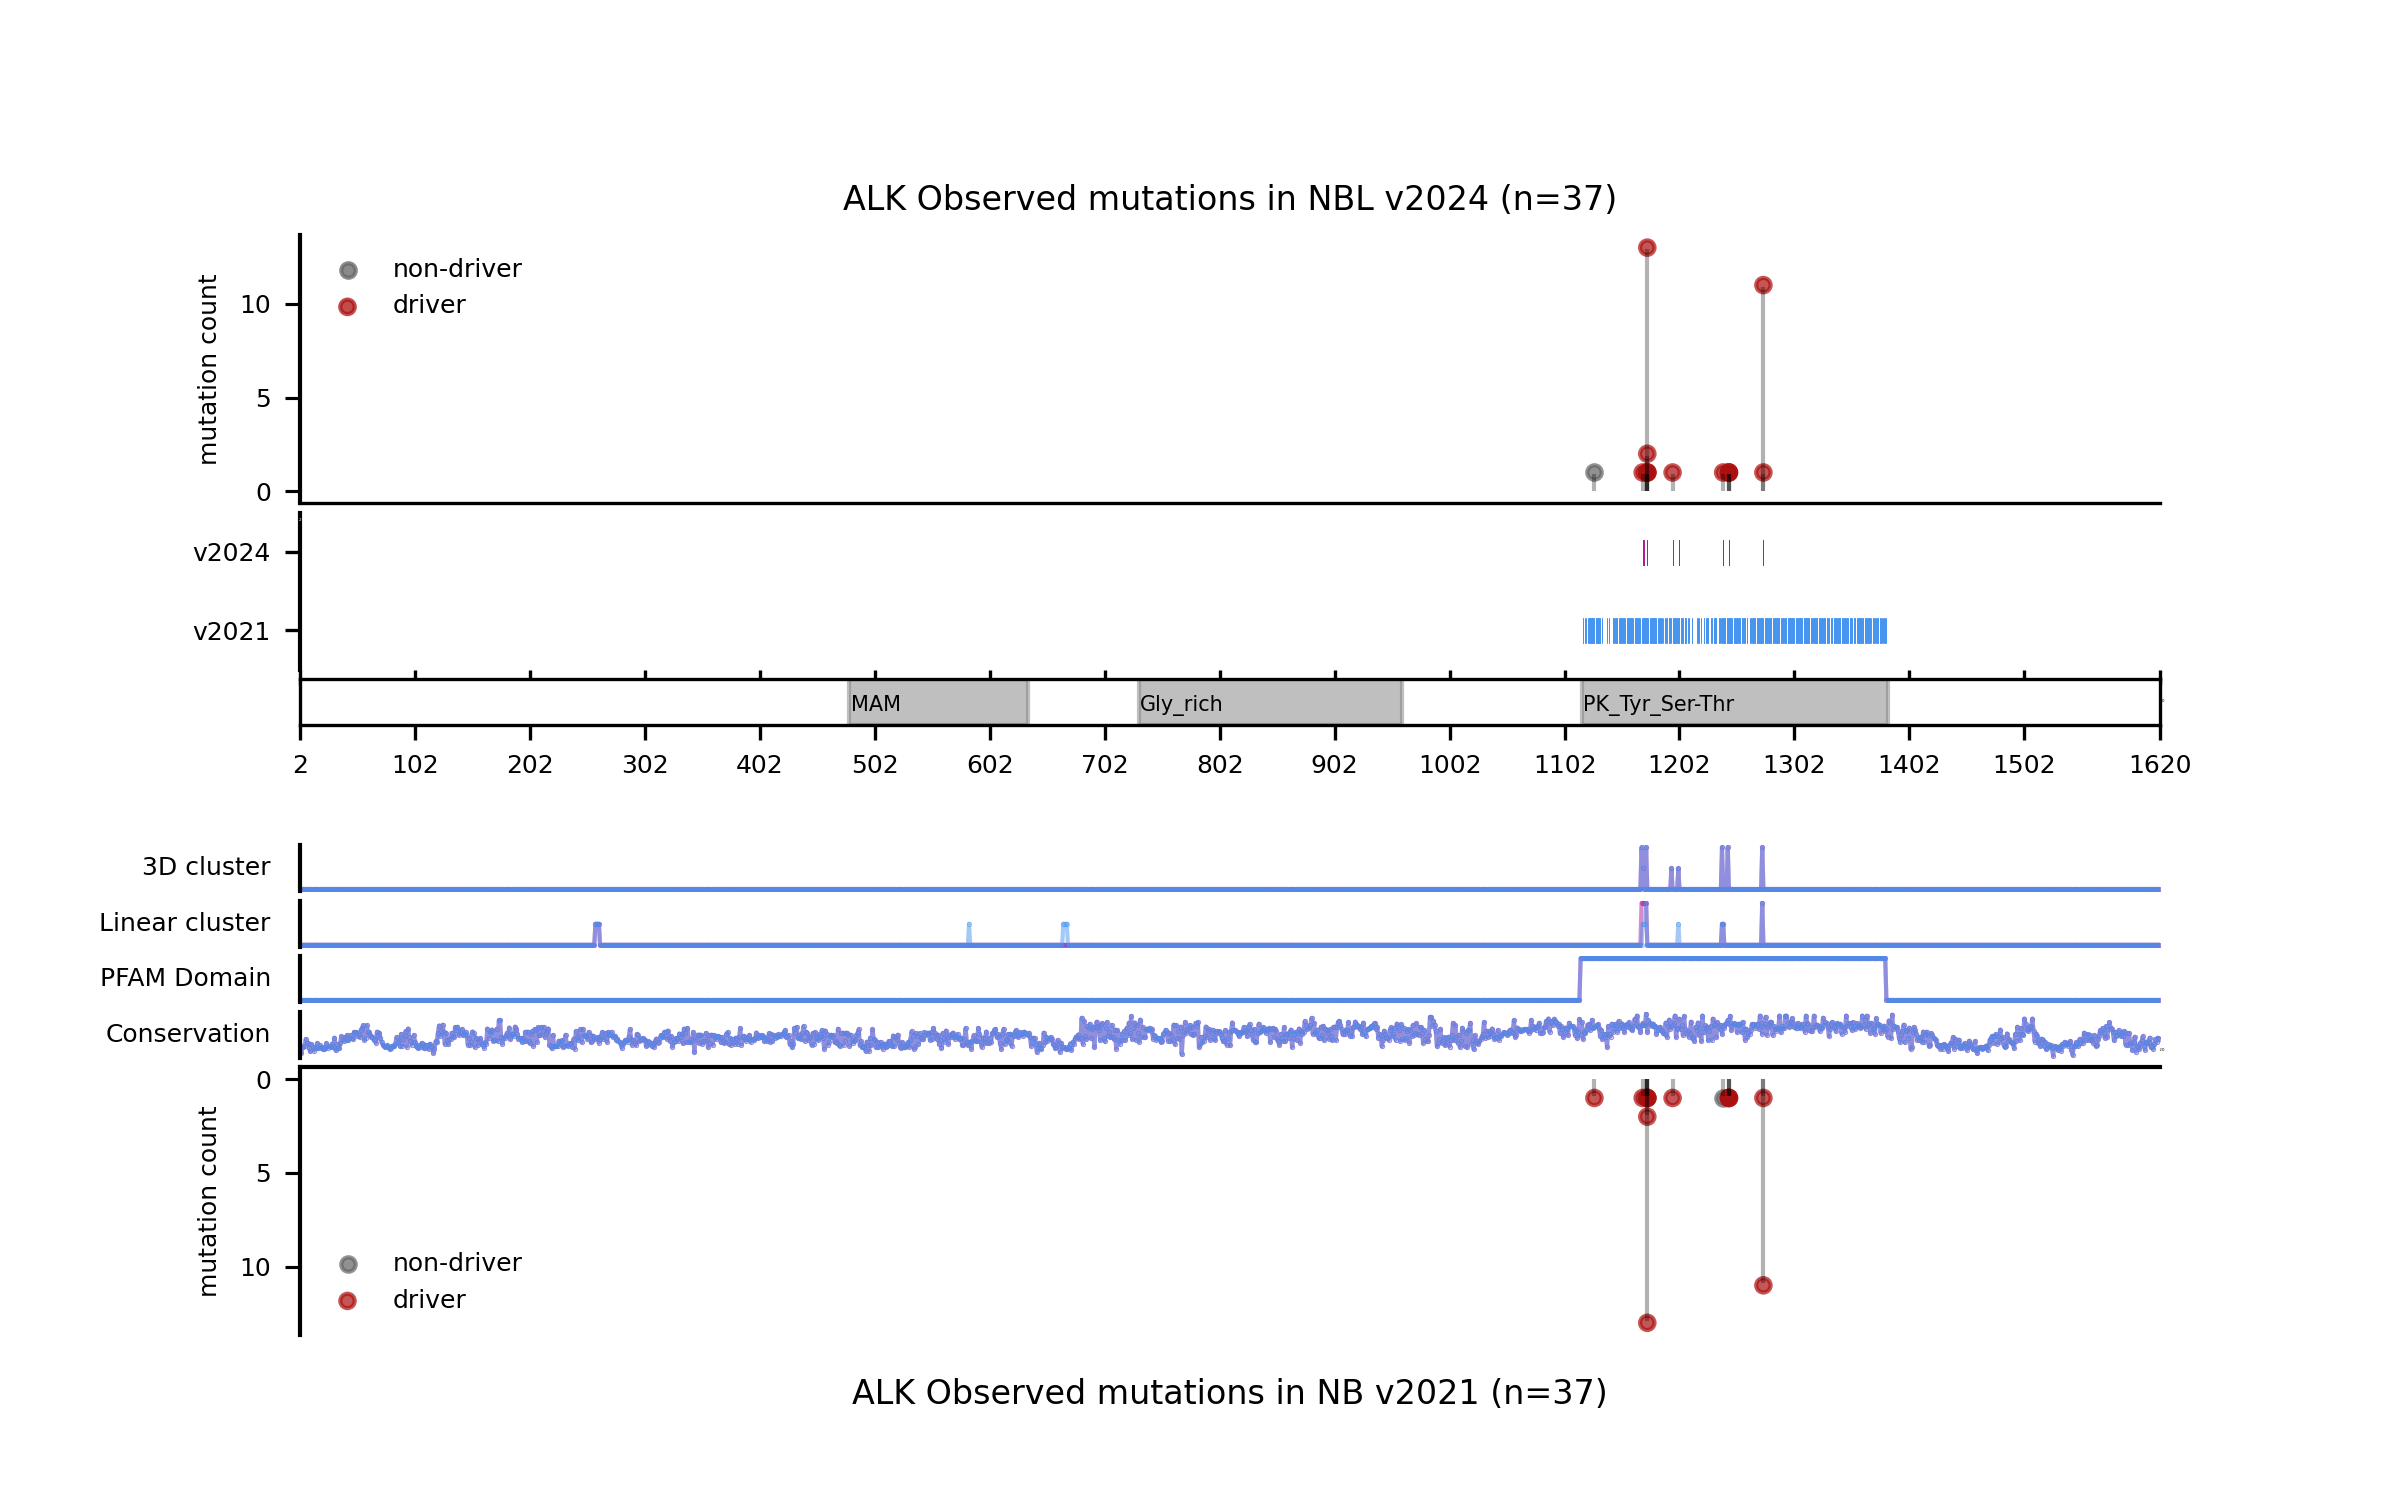
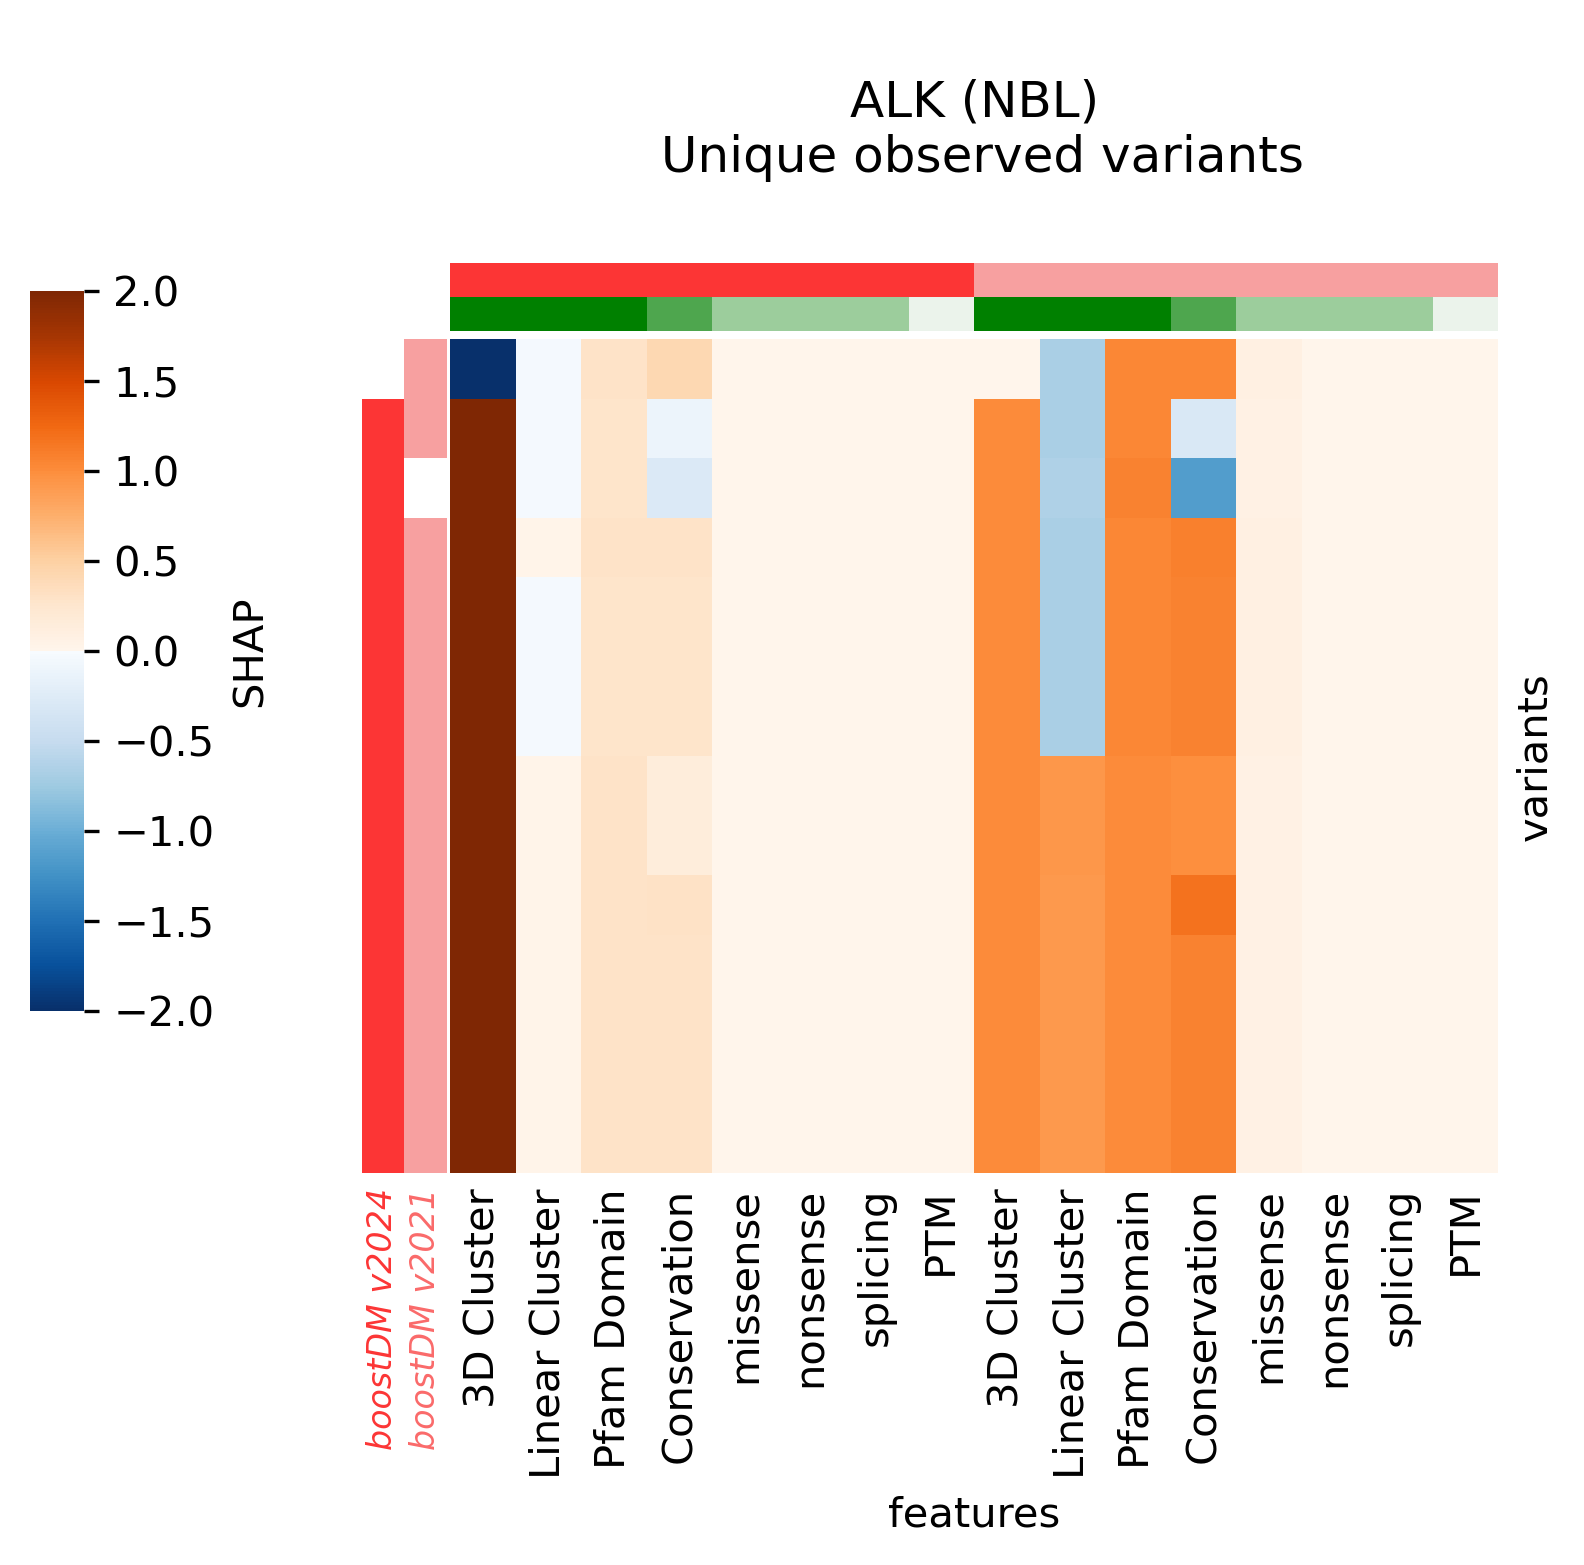
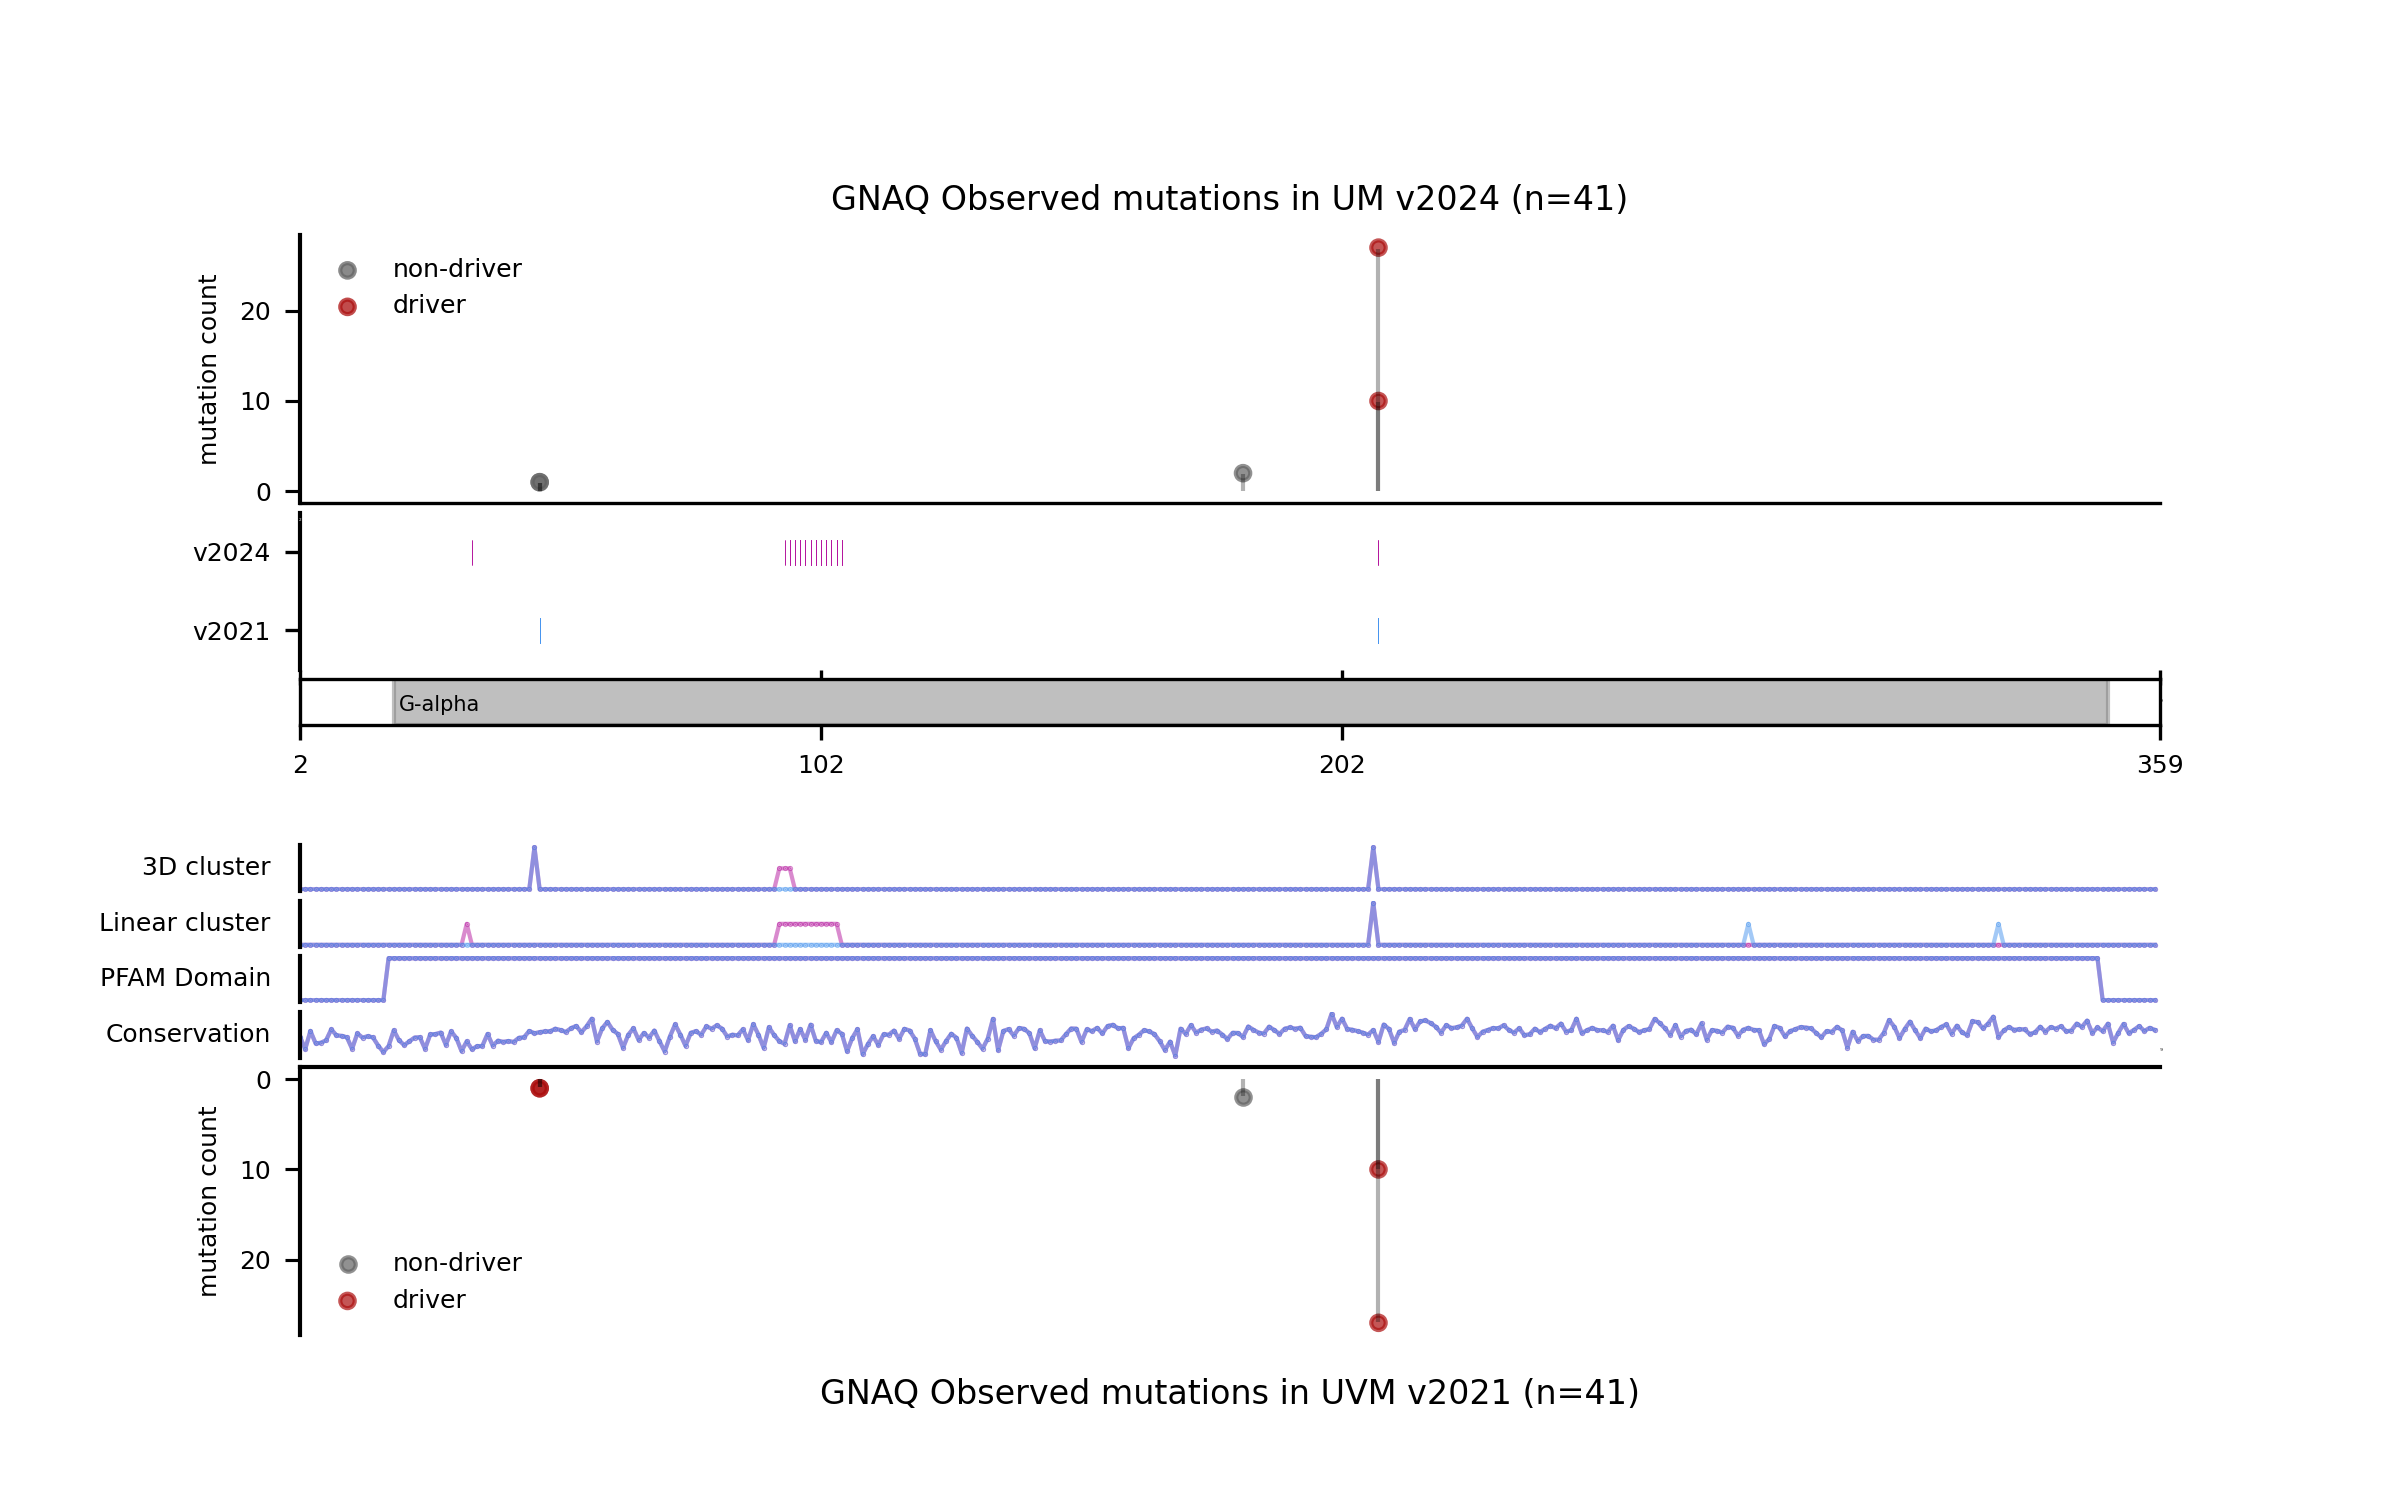
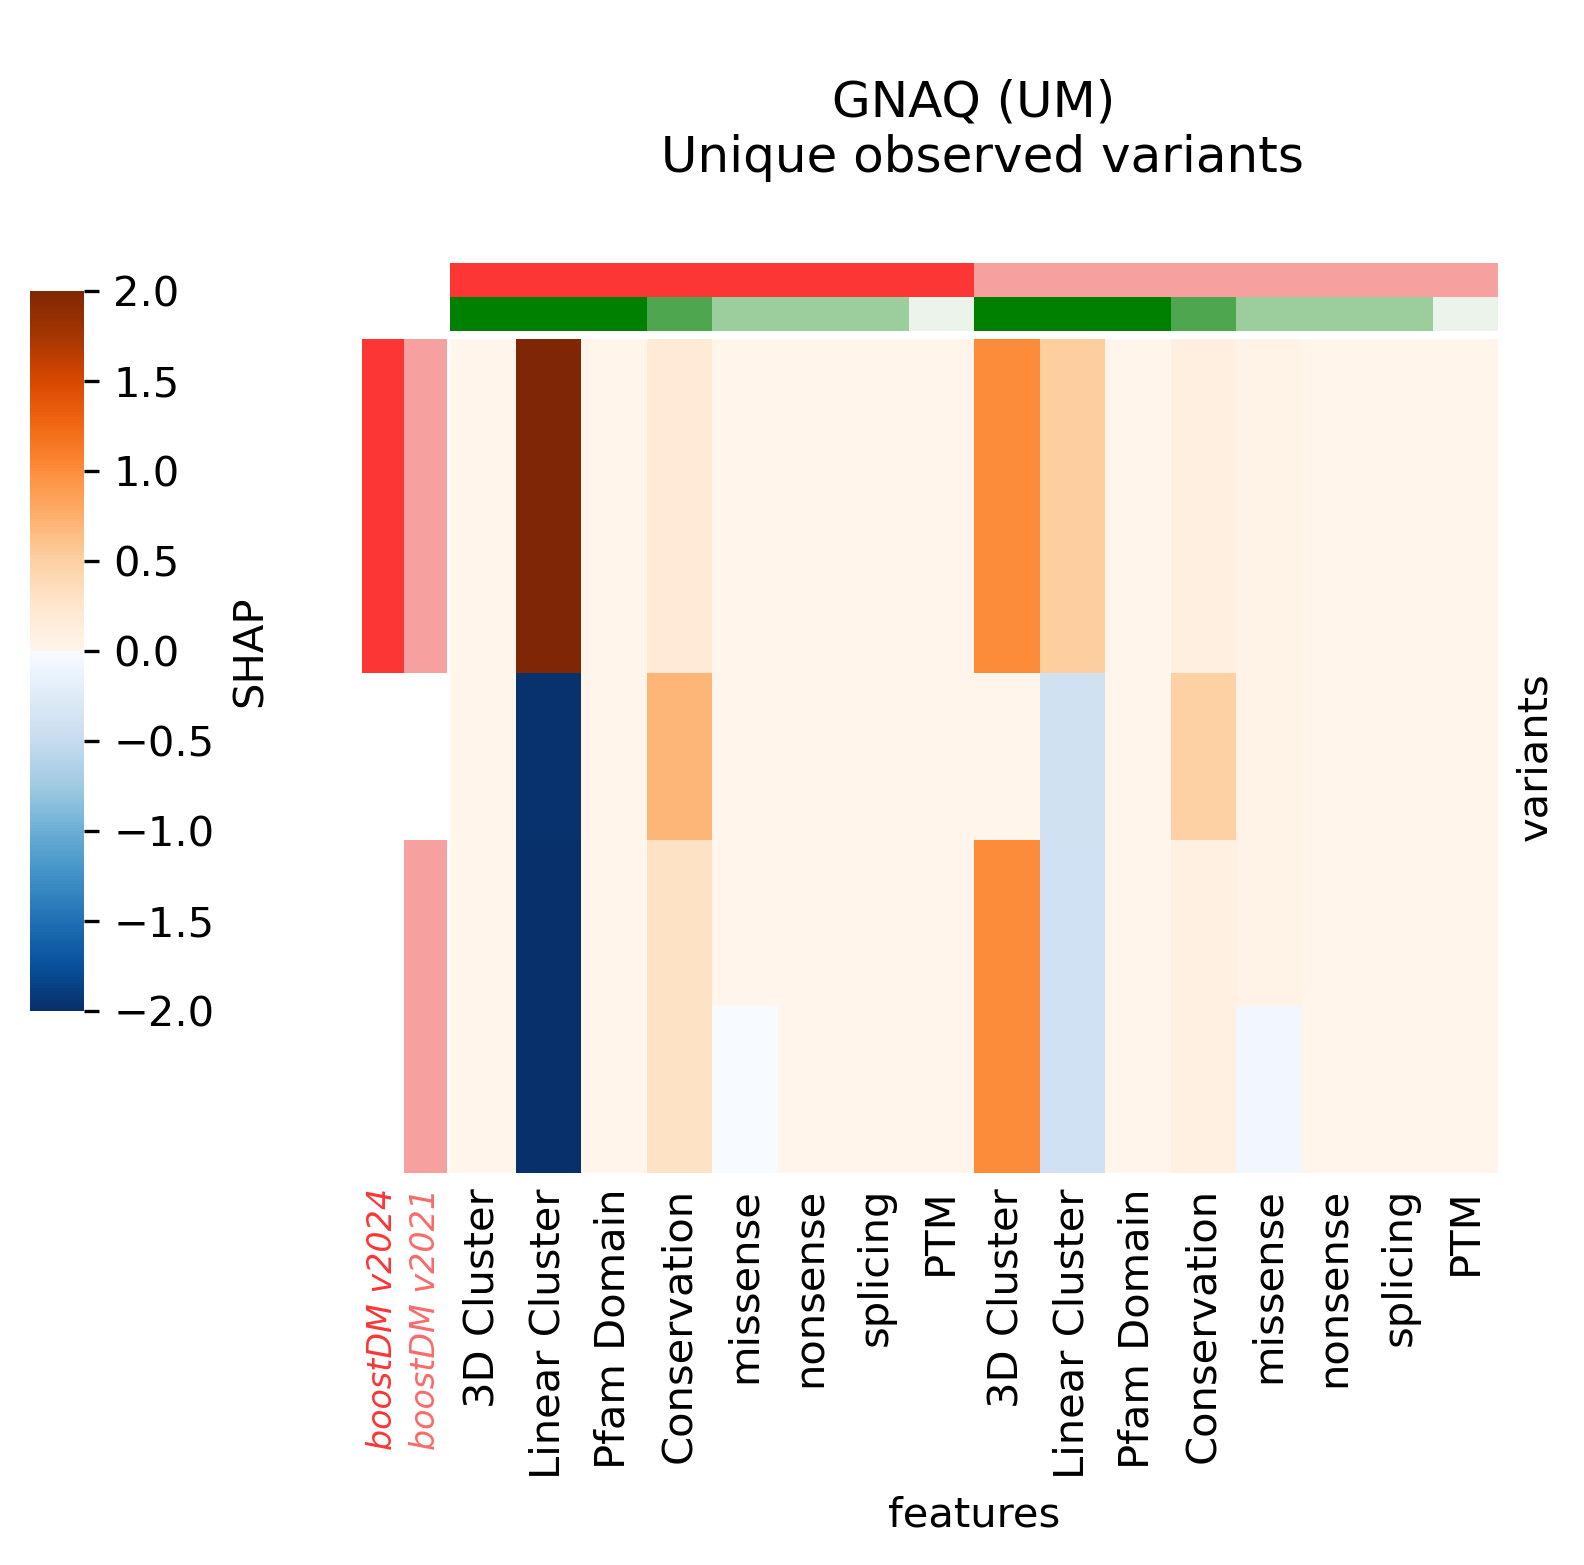
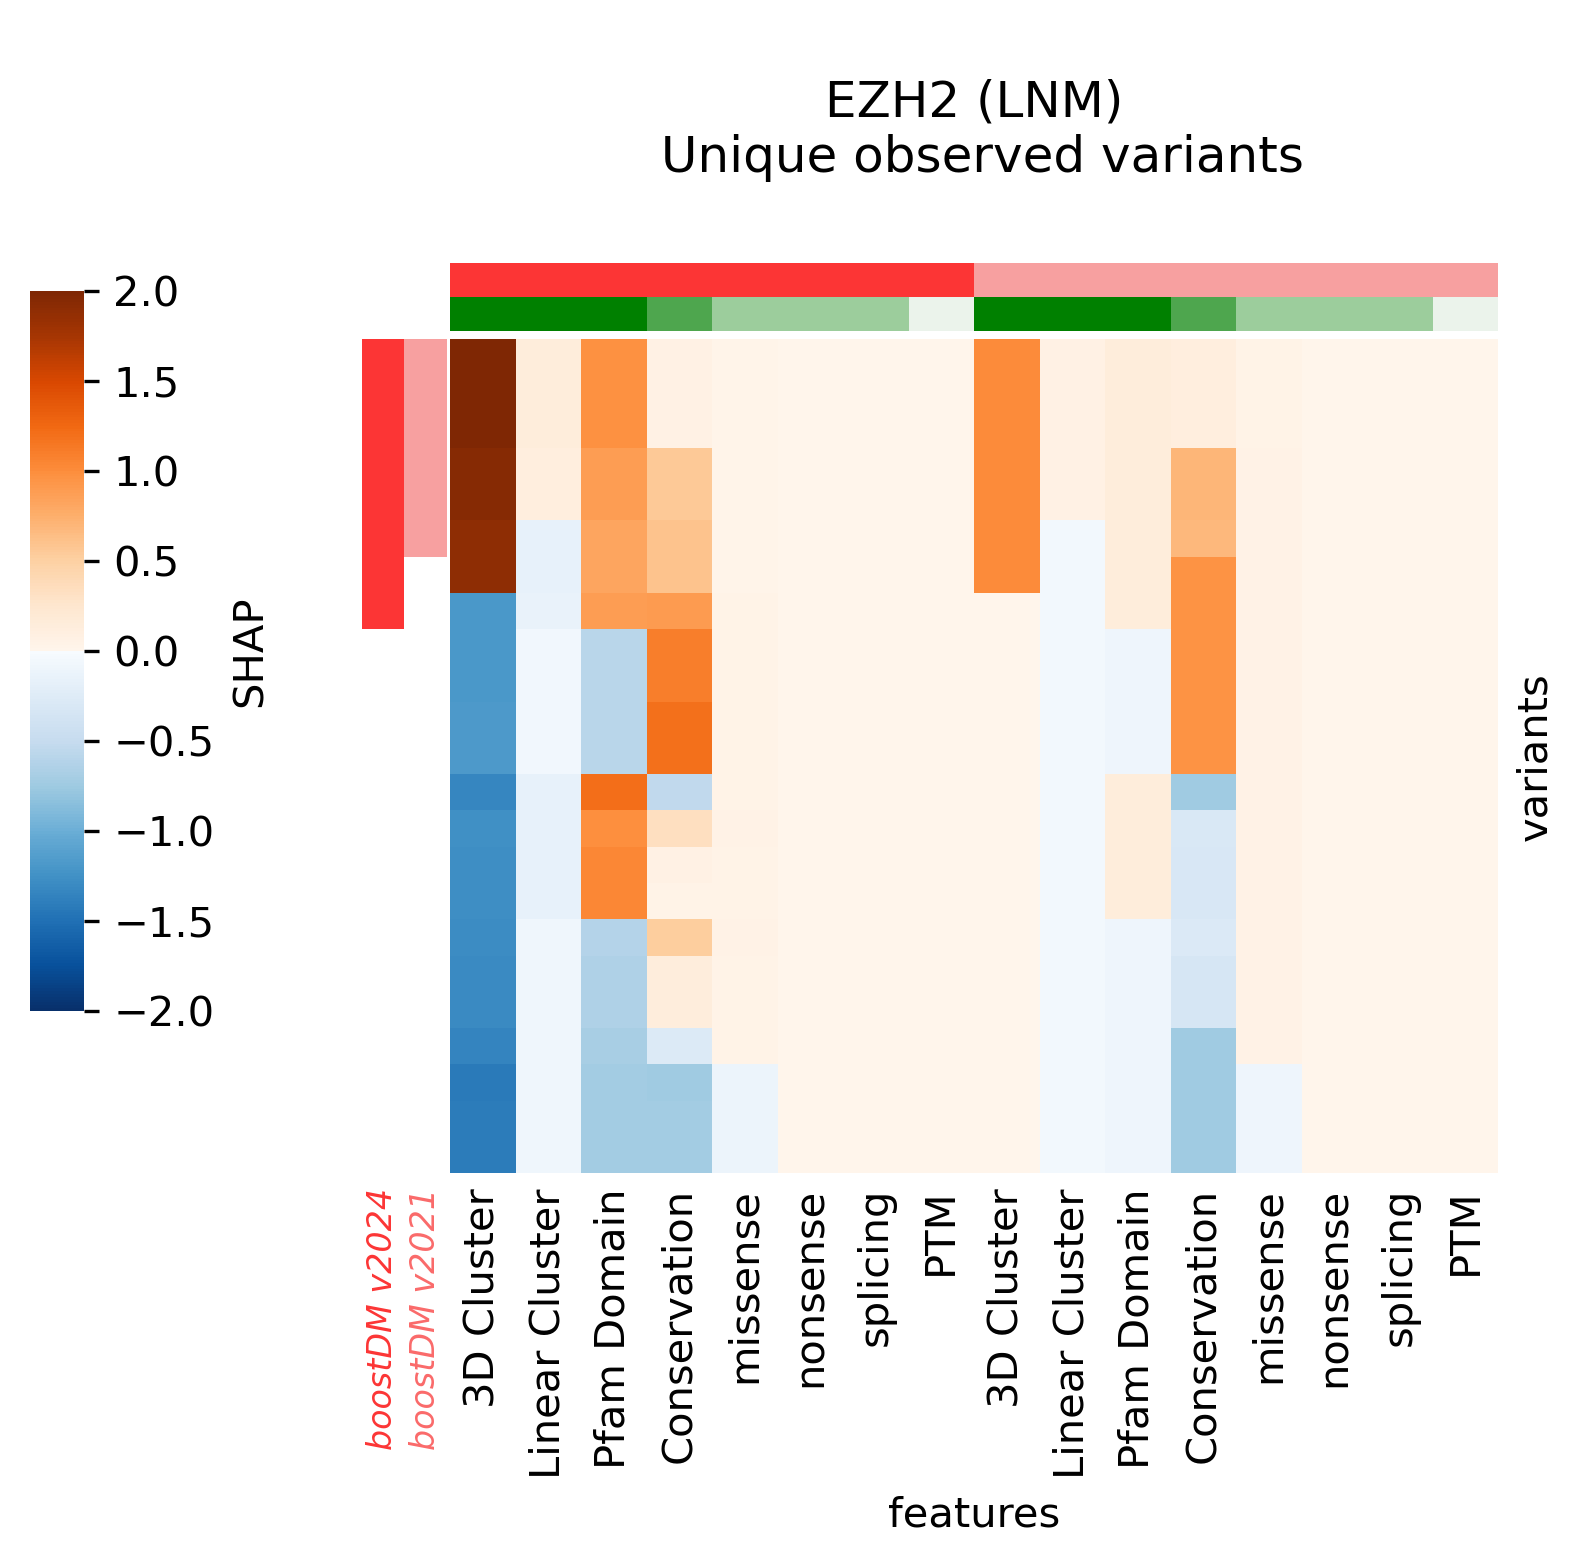
Snapshots corresponding to gene models for genes that were not previously covered by high-quality models. Local feature explanations of the driver predictions corresponding to the catalog of unique variants observed in the MANE Select regions of interest.
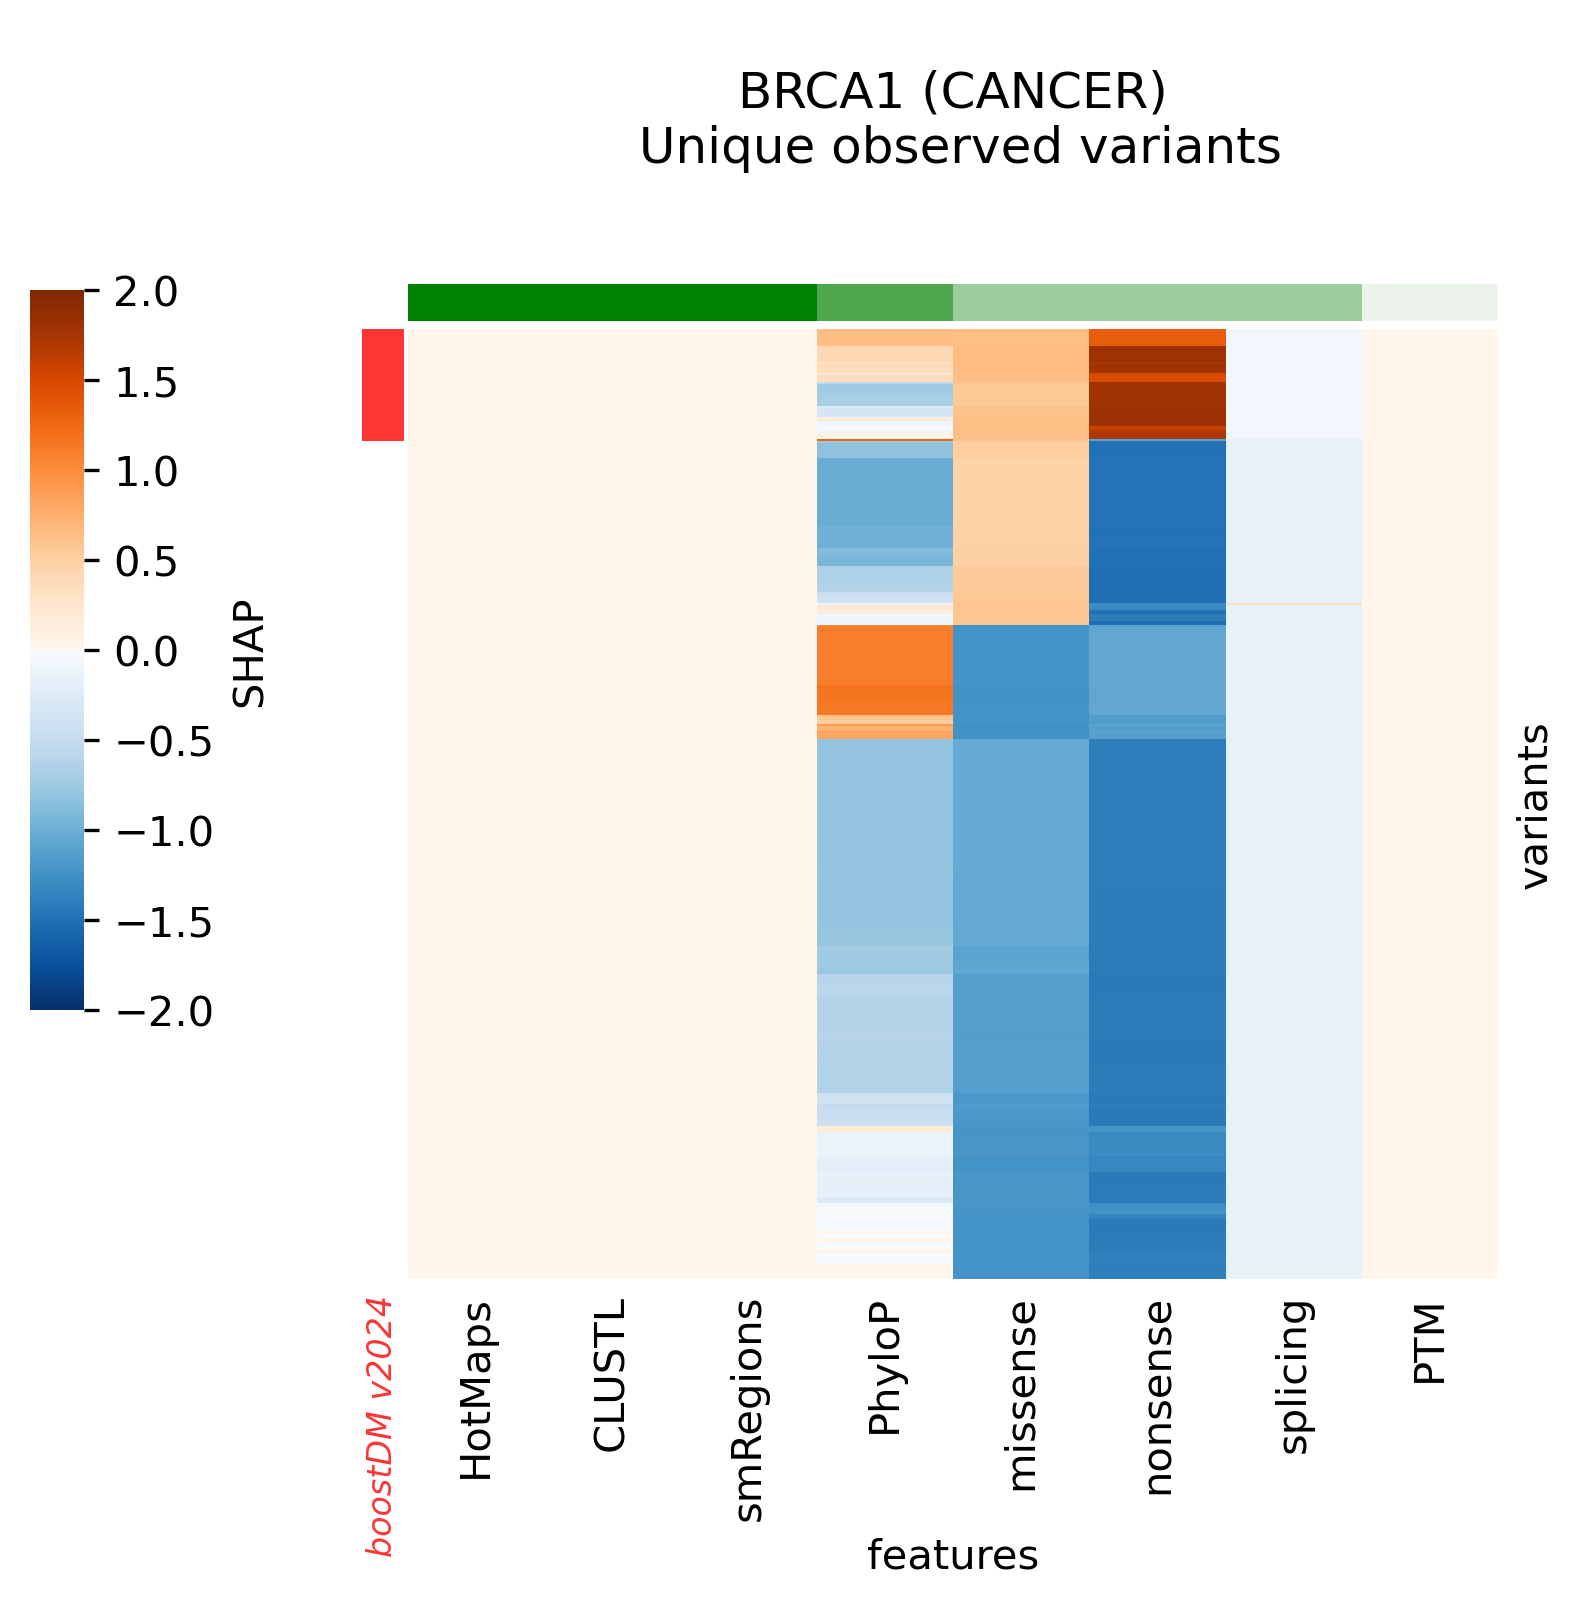
Snapshots corresponding to gene models for genes that were not previously covered by high-quality models. Local feature explanations of the driver predictions corresponding to the catalog of unique variants observed in the MANE Select regions of interest.
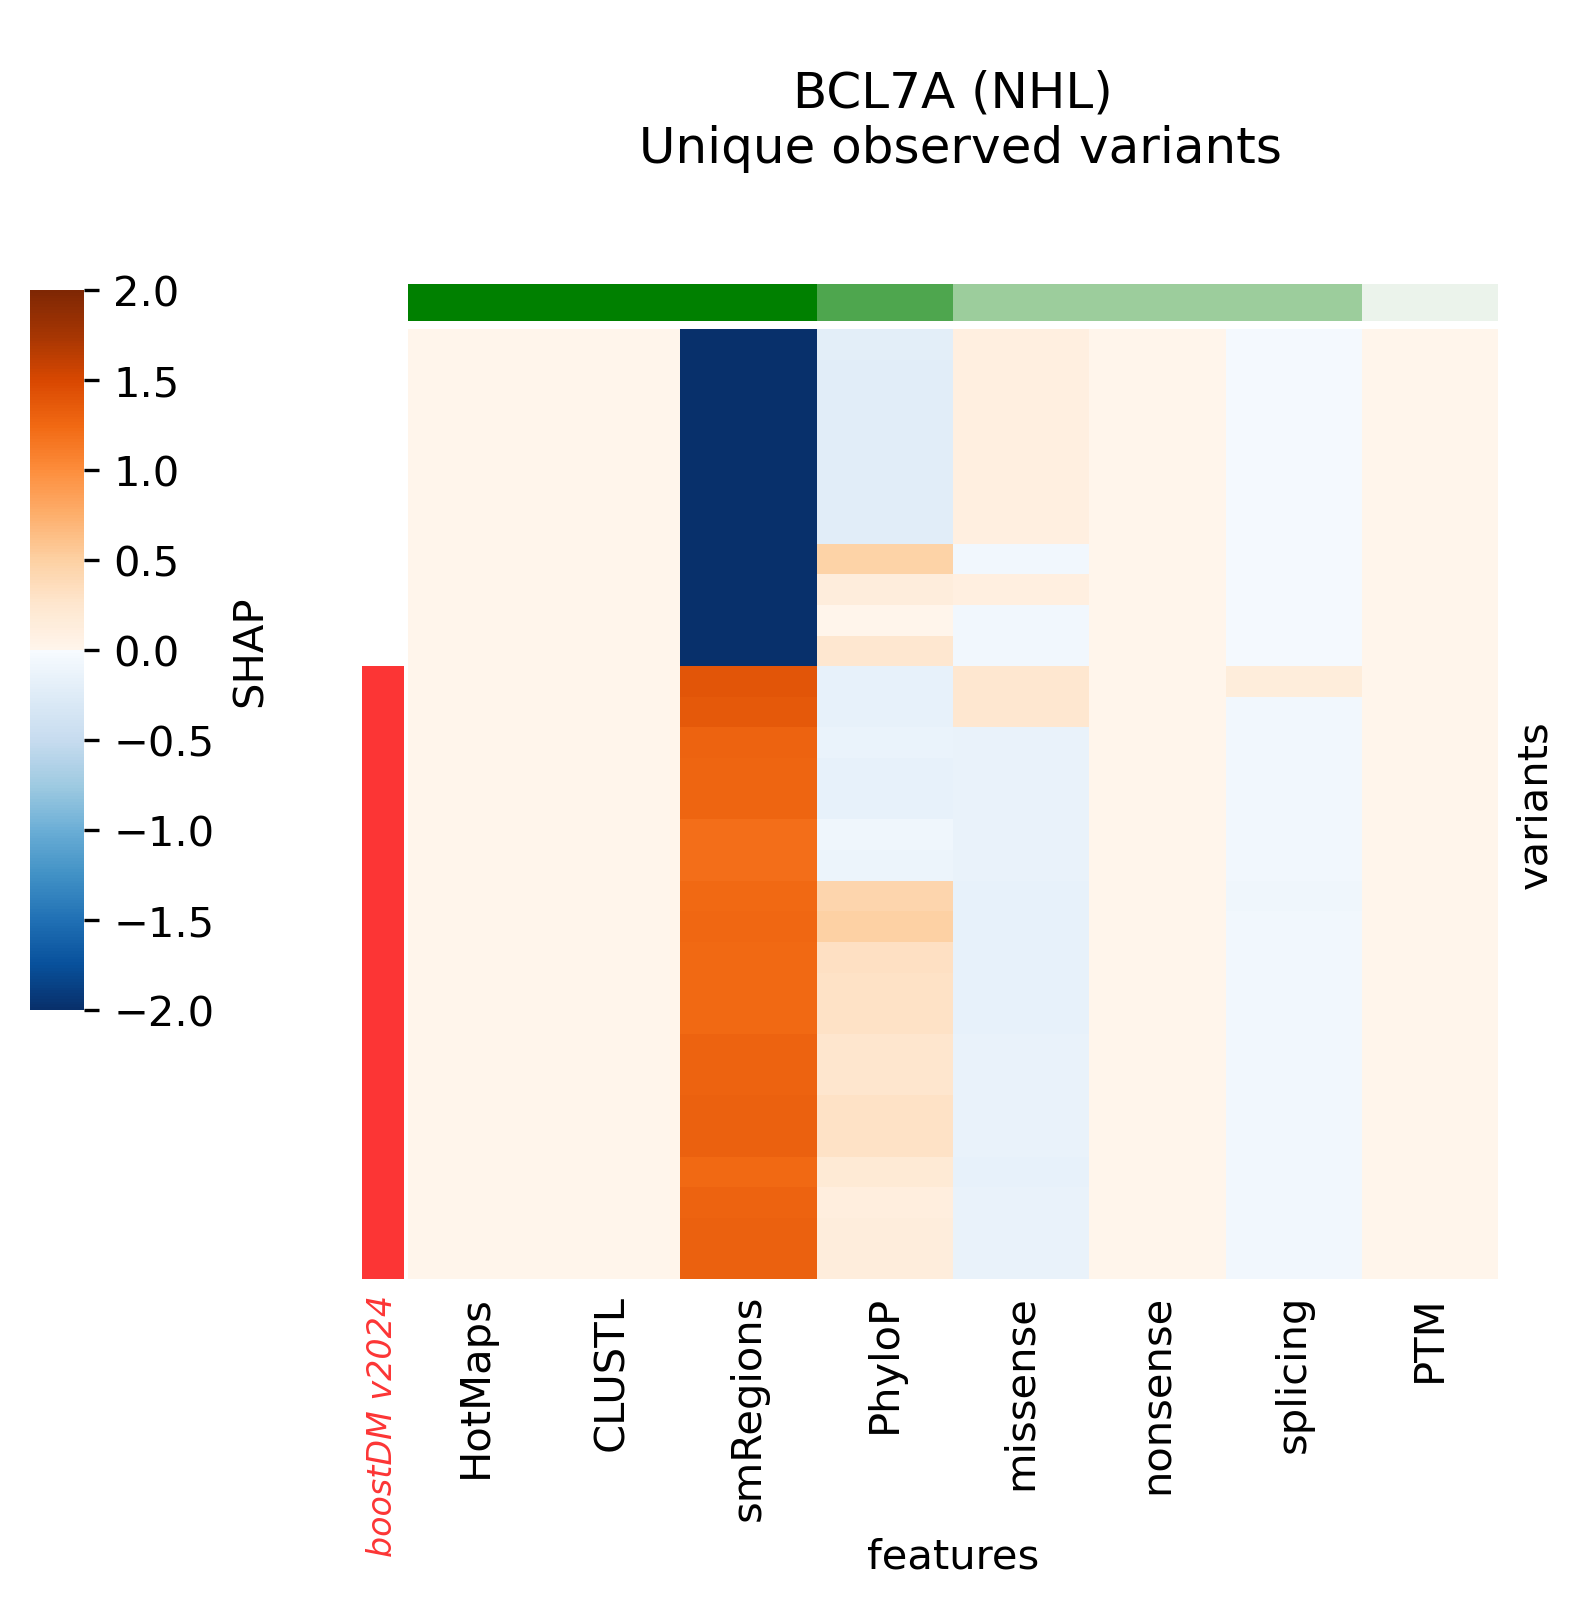
Snapshots corresponding to gene models for genes that were not previously covered by high-quality models. Local feature explanations of the driver predictions corresponding to the catalog of unique variants observed in the MANE Select regions of interest.
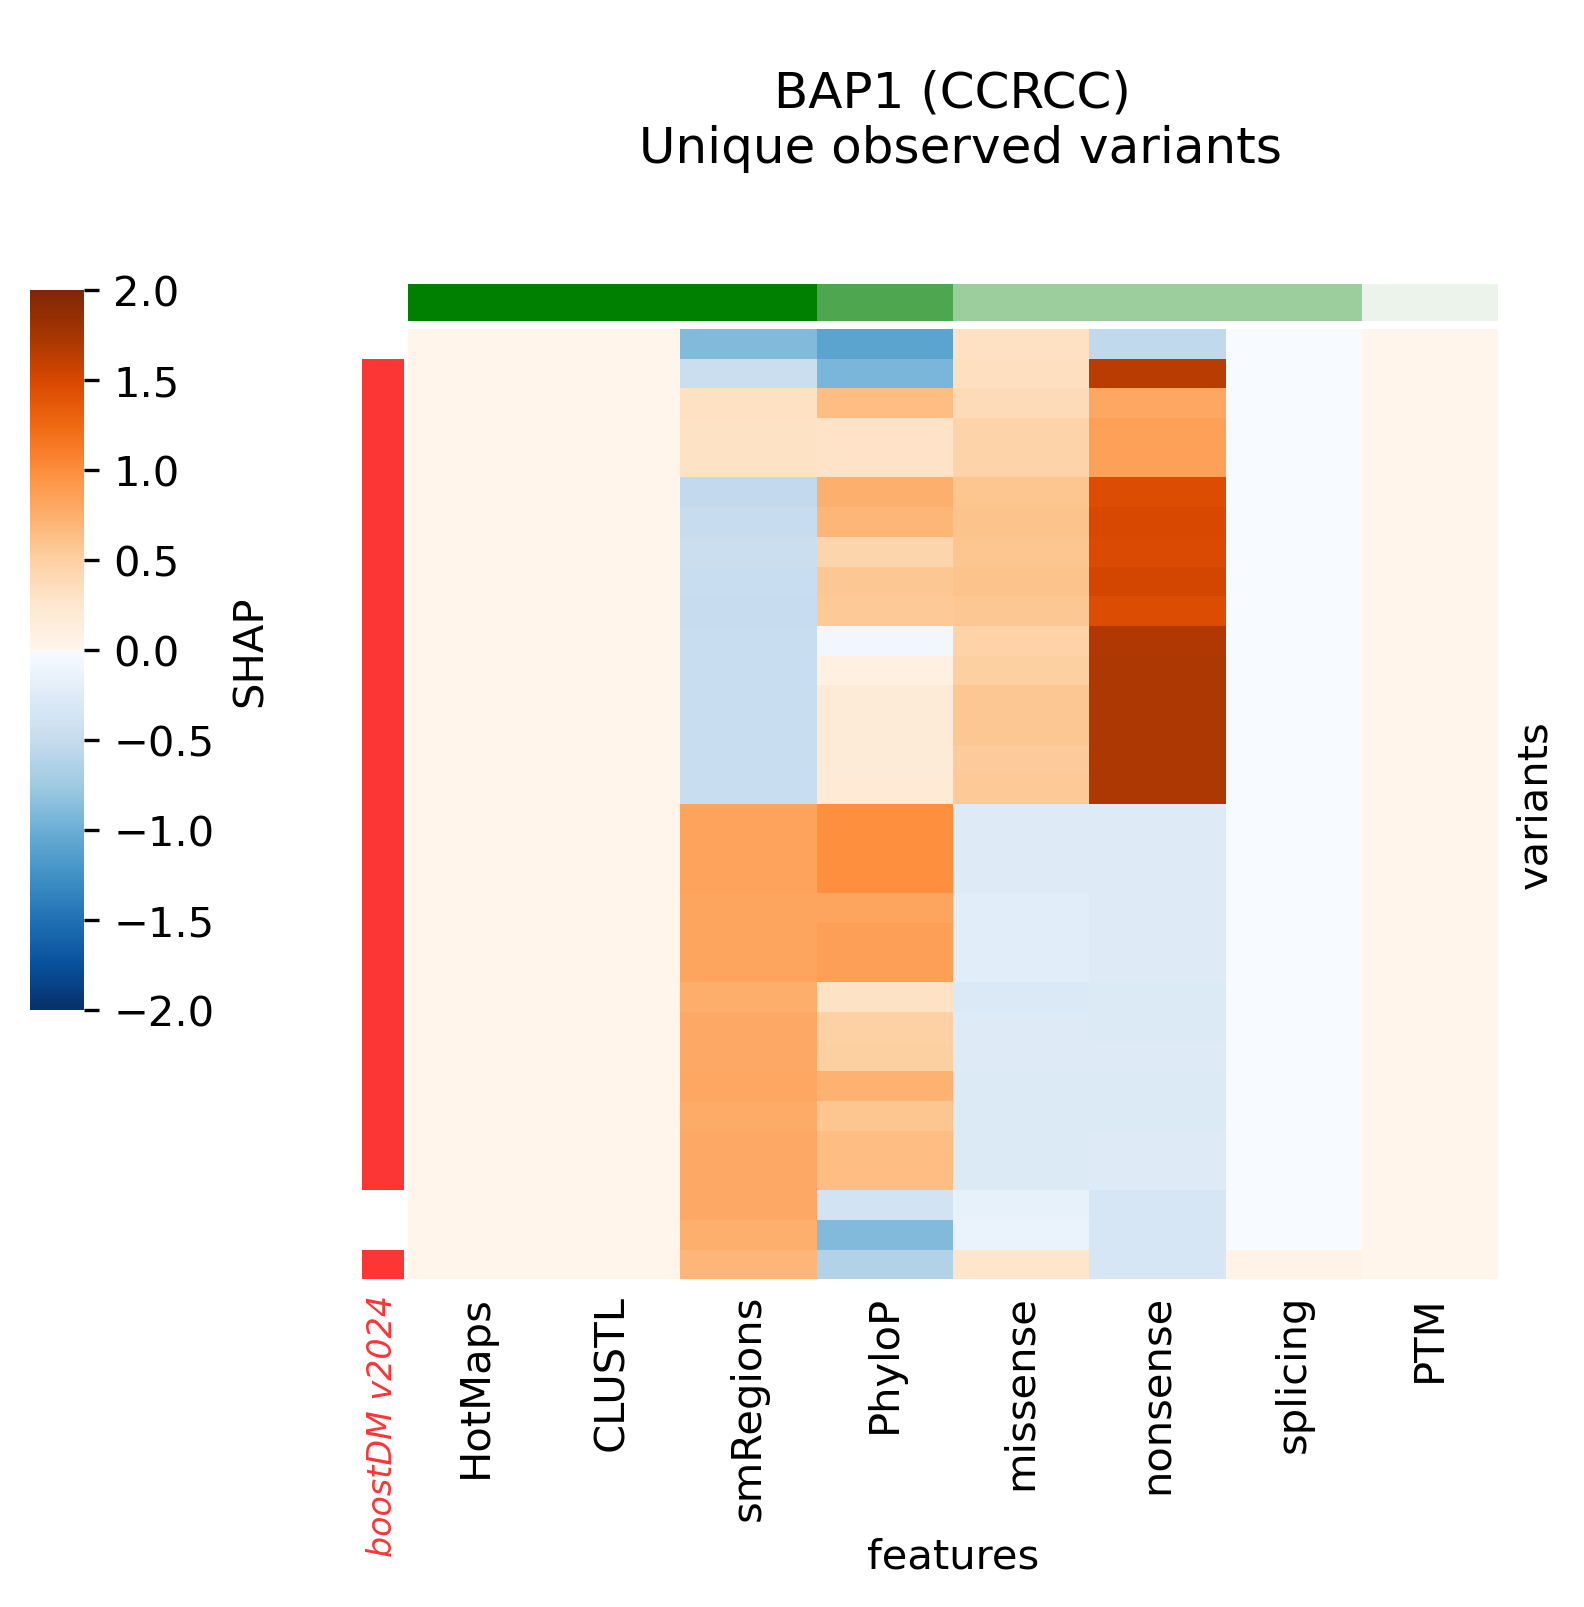
Snapshots corresponding to gene models for genes that were not previously covered by high-quality models. Local feature explanations of the driver predictions corresponding to the catalog of unique variants observed in the MANE Select regions of interest.
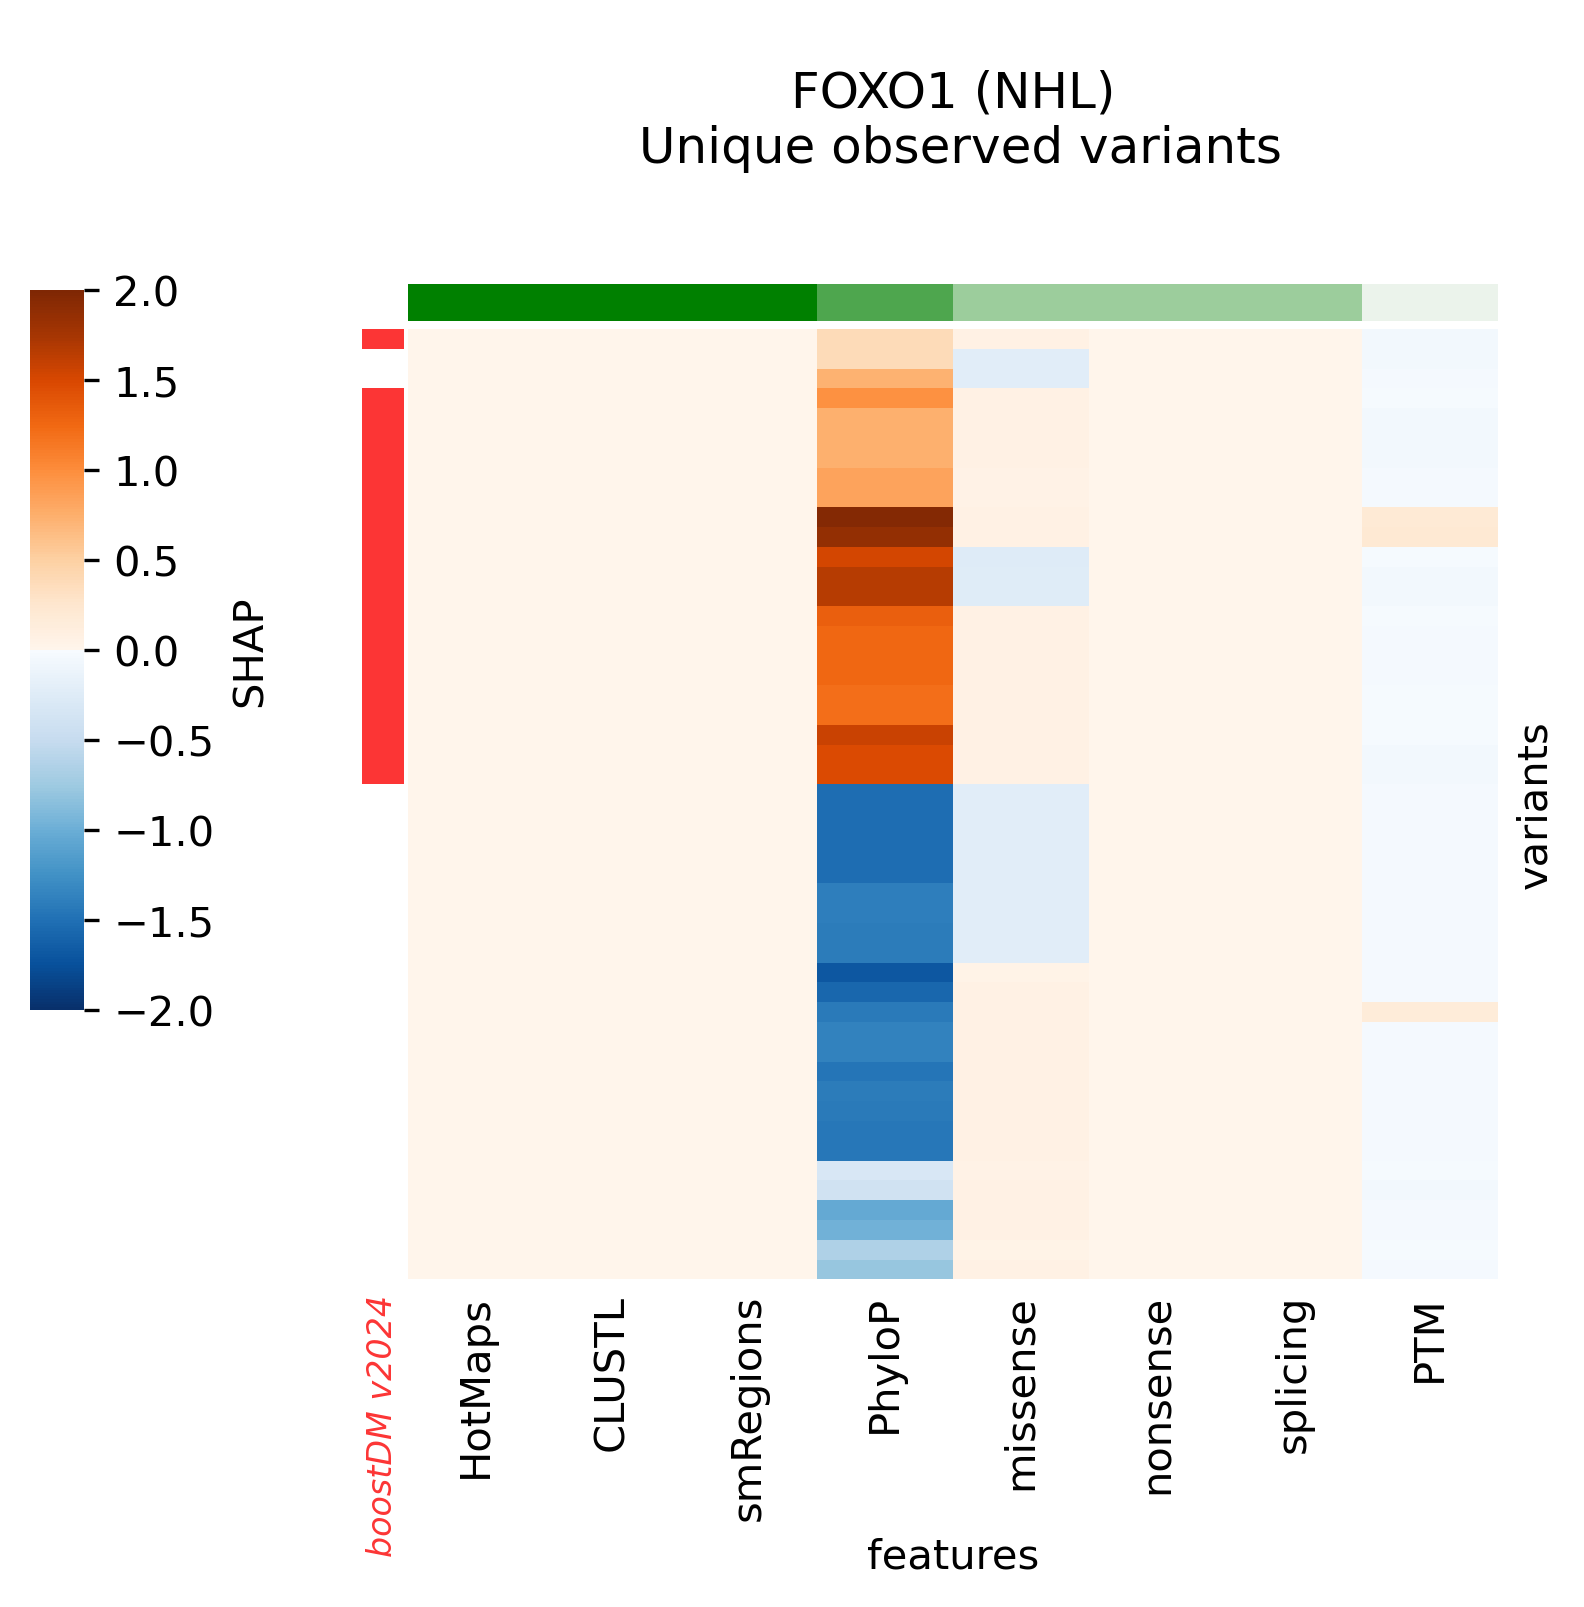
Snapshots corresponding to gene models for genes that were not previously covered by high-quality models. Local feature explanations of the driver predictions corresponding to the catalog of unique variants observed in the MANE Select regions of interest.
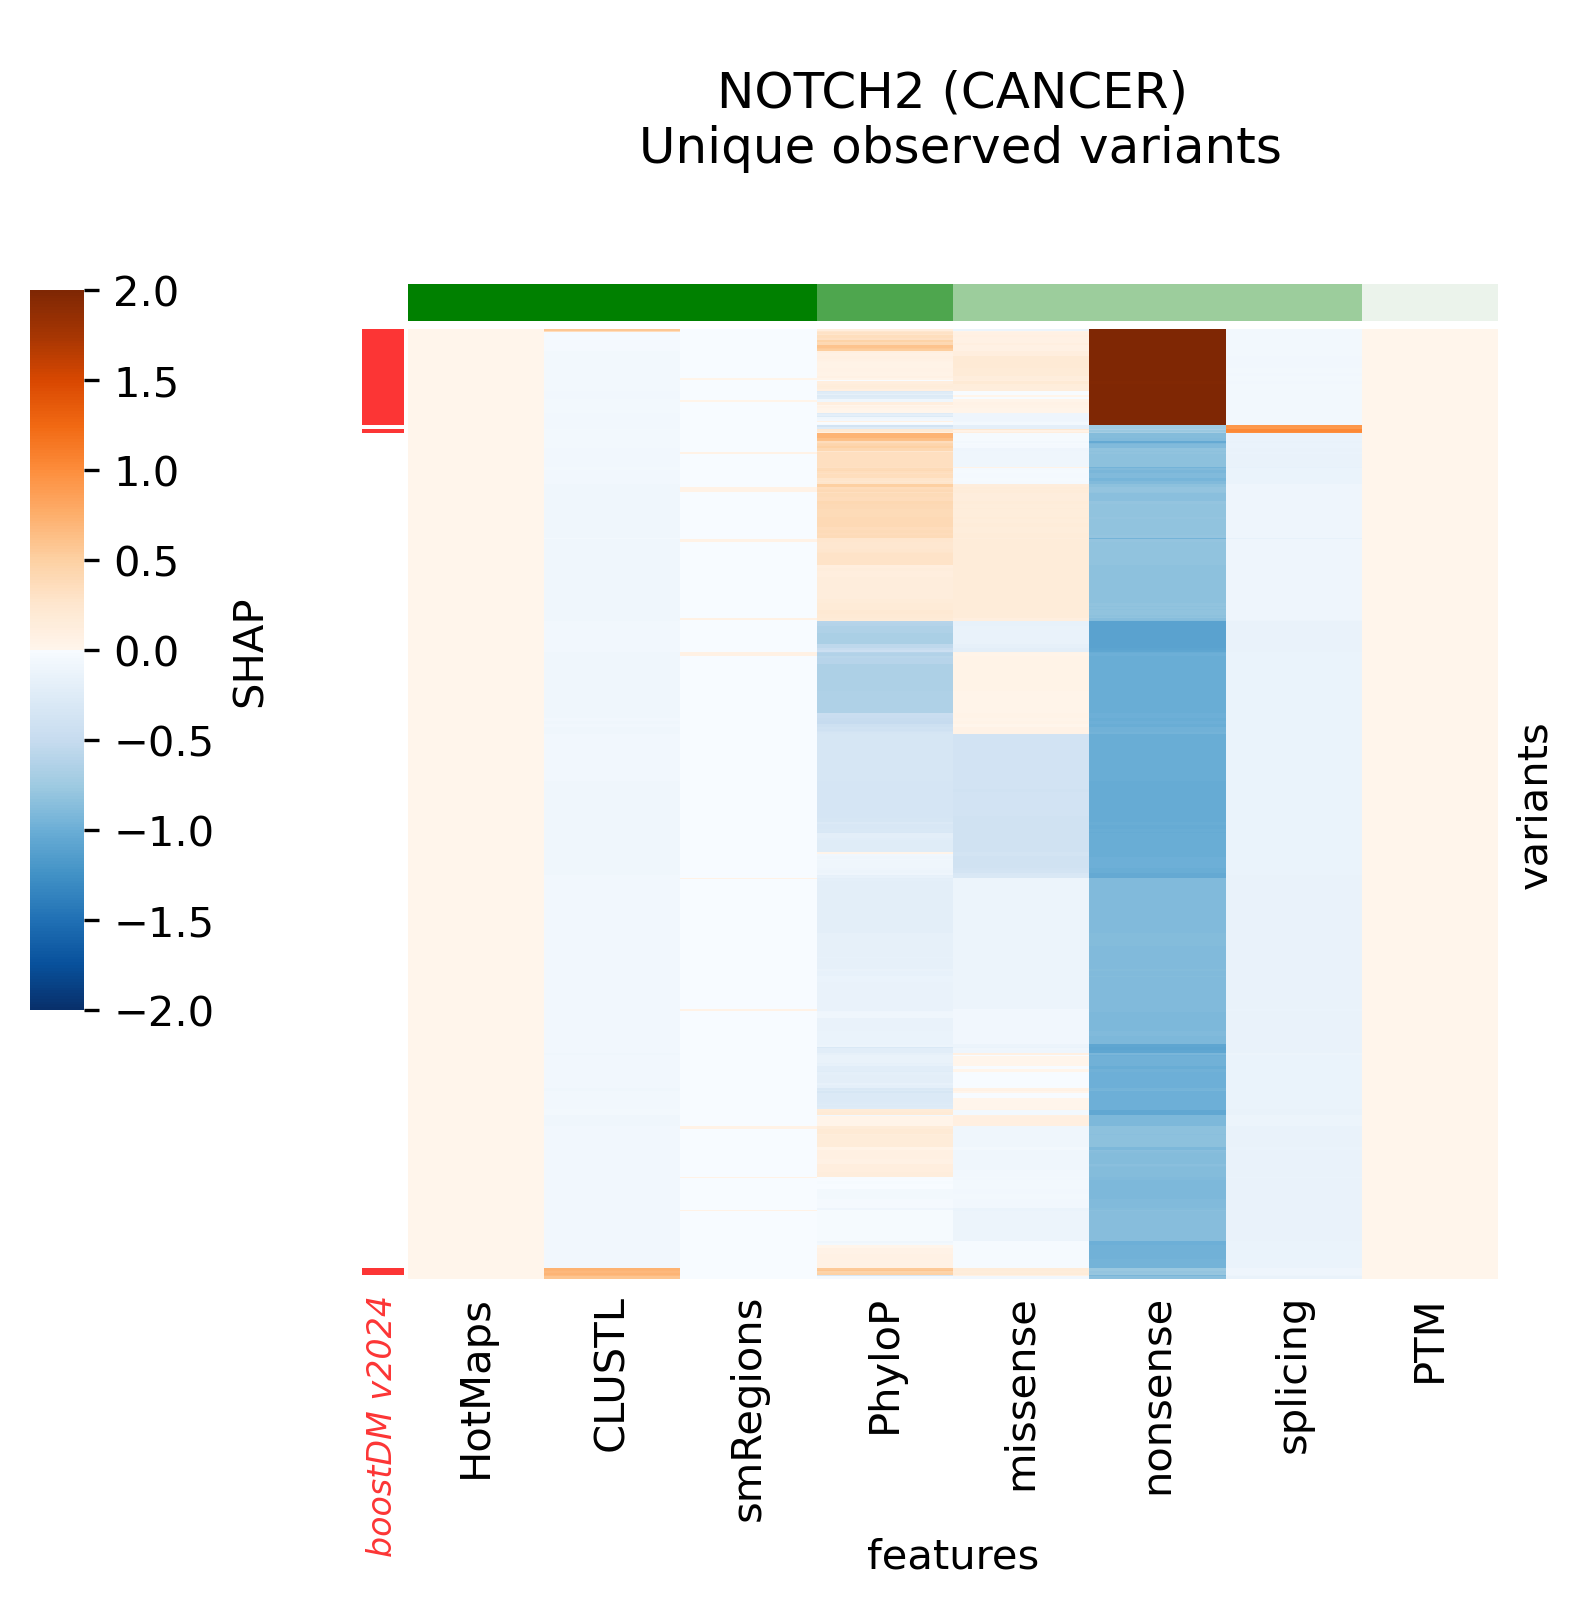
Snapshots corresponding to gene models for genes that were not previously covered by high-quality models. Local feature explanations of the driver predictions corresponding to the catalog of unique variants observed in the MANE Select regions of interest.
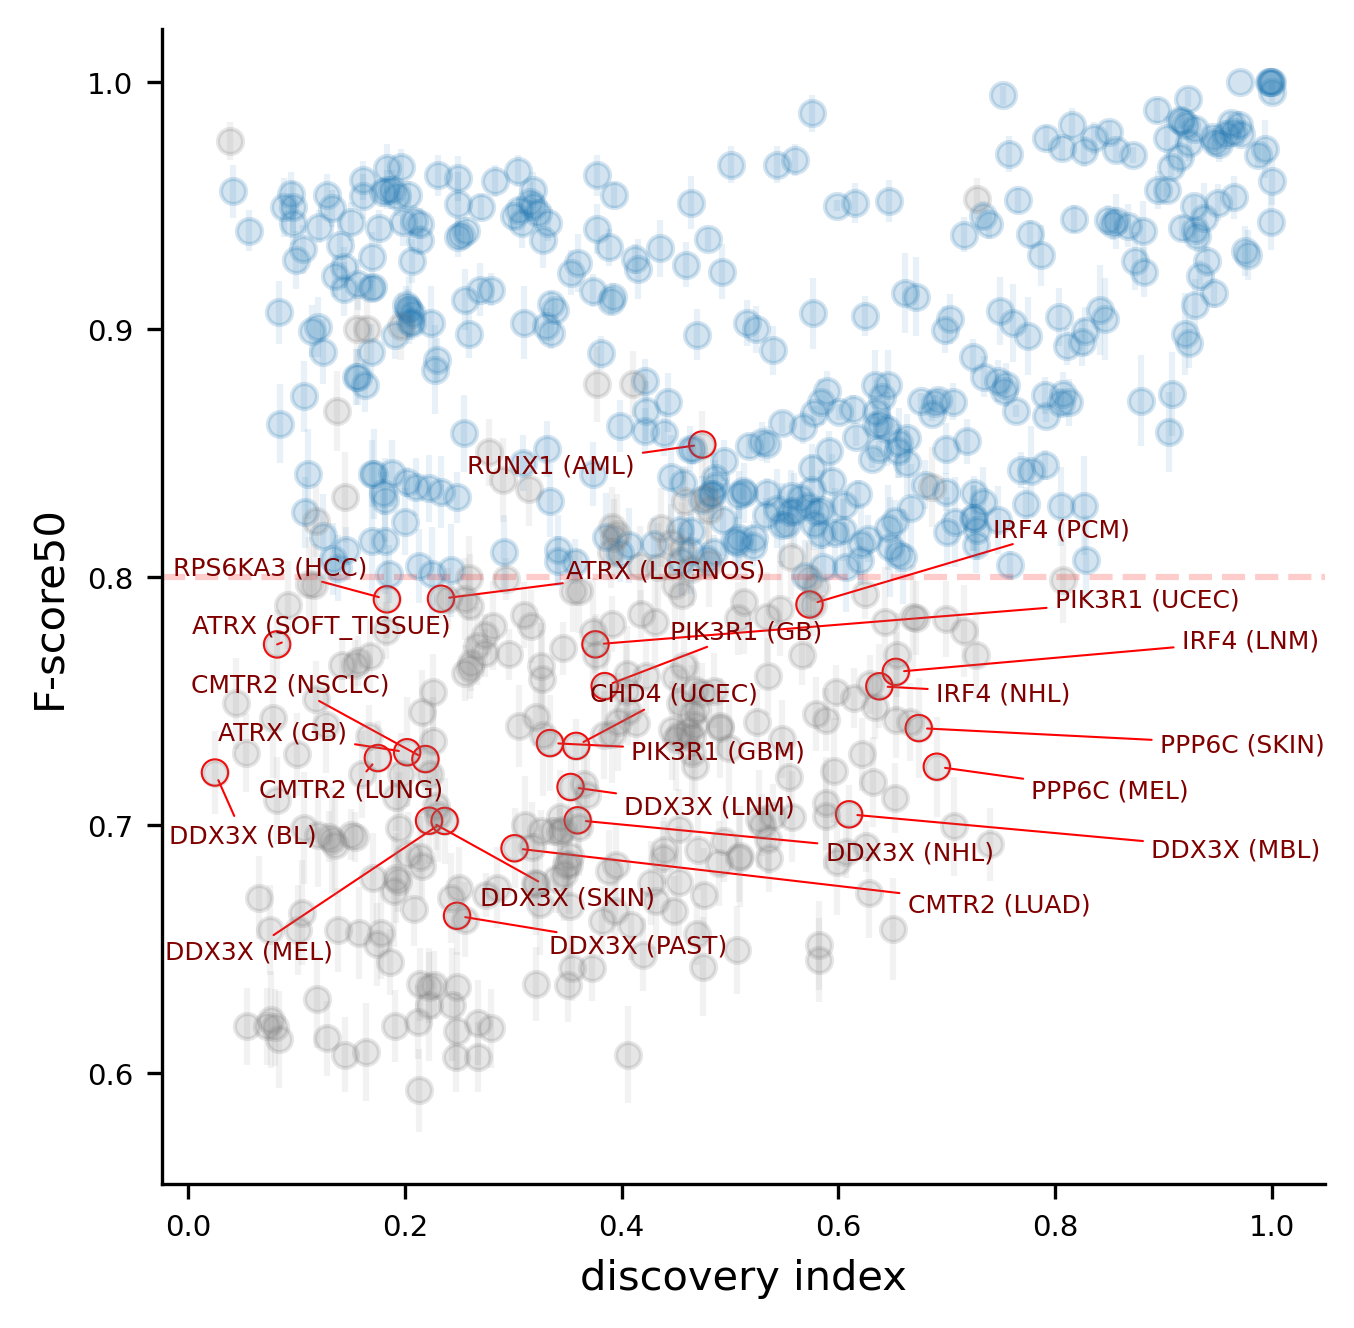
Nine (9) genes that had at least one high-quality model in boostDM v2021 do not have a high-quality model anymore. The complete list of downgraded genes is the following:
ATRX, CHD4, CMTR2, DDX3X, IRF4, PIK3R1, PPP6C, RPS6KA3, RUNX1
All the gene models except RUNX1 dropped because their CV performance fell below the minimum 0.8 mean F-score50 required. In the case of the RUNX1 (Acute Myeloid Leukemia) the model did not fulfill the criteria regarding the number of observed mutations and discovery index.
Since the oncotree tumor type ontology that boostDM resorts to has changed since v2021, in order to carry out a proper comparison we must define a subset of gene tumor type combinations for which we can find equivalences across releases and for which high-quality models were implemented in the previous release. Concretely, the gene and tumor type combination pool for this analysis is defined as follows:
The genes comprised are the following in alphabetical order: AKT1, ALK, AMER1, APC, AR, ARID1A, ARID2, AXIN1, BCLAF1, BRAF, CD79B, CDH1, CDK12, CDKN2A, CIC, CREBBP, CTCF, CTNNB1, EGFR, EP300, ERBB3, ERCC2, ESR1, EZH2, FAT1, FBXW7, FGFR3, FLT3, FOXA1, GNA11, GNAQ, GTF2I, HRAS, IDH1, IDH2, KDM6A, KMT2C, KMT2D, KRAS, MAP3K1, MEF2B, MYD88, NCOR1, NF1, NFE2L2, NOTCH1, NRAS, NSD1, PBRM1, PCBP1, PIK3CA, PPP2R1A, PTEN, PTPN11, RAC1, RB1, RBM10, SETD2, SF3B1, SMAD4, SMARCA4, SPOP, STAG2, STK11, TP53, TSC1, U2AF1, VHL.
The discovery index turns out to be stable between releases, with some instances where it has increased significantly, most prominently in the LNM cohort with genes like TP53, CREBBP and HLA-B showing a sharp increase. Although the discovery index is not guaranteed to always increase – the cohorts of tumors recruited may not be as homogenous despite matching the same tumor type, e.g. due to differences in tumorigenic selection across ancestral populations or due to differential environmental exposures – the fact that the discovery index does not drop significantly in any case is a proof of the robustness of the methodology.
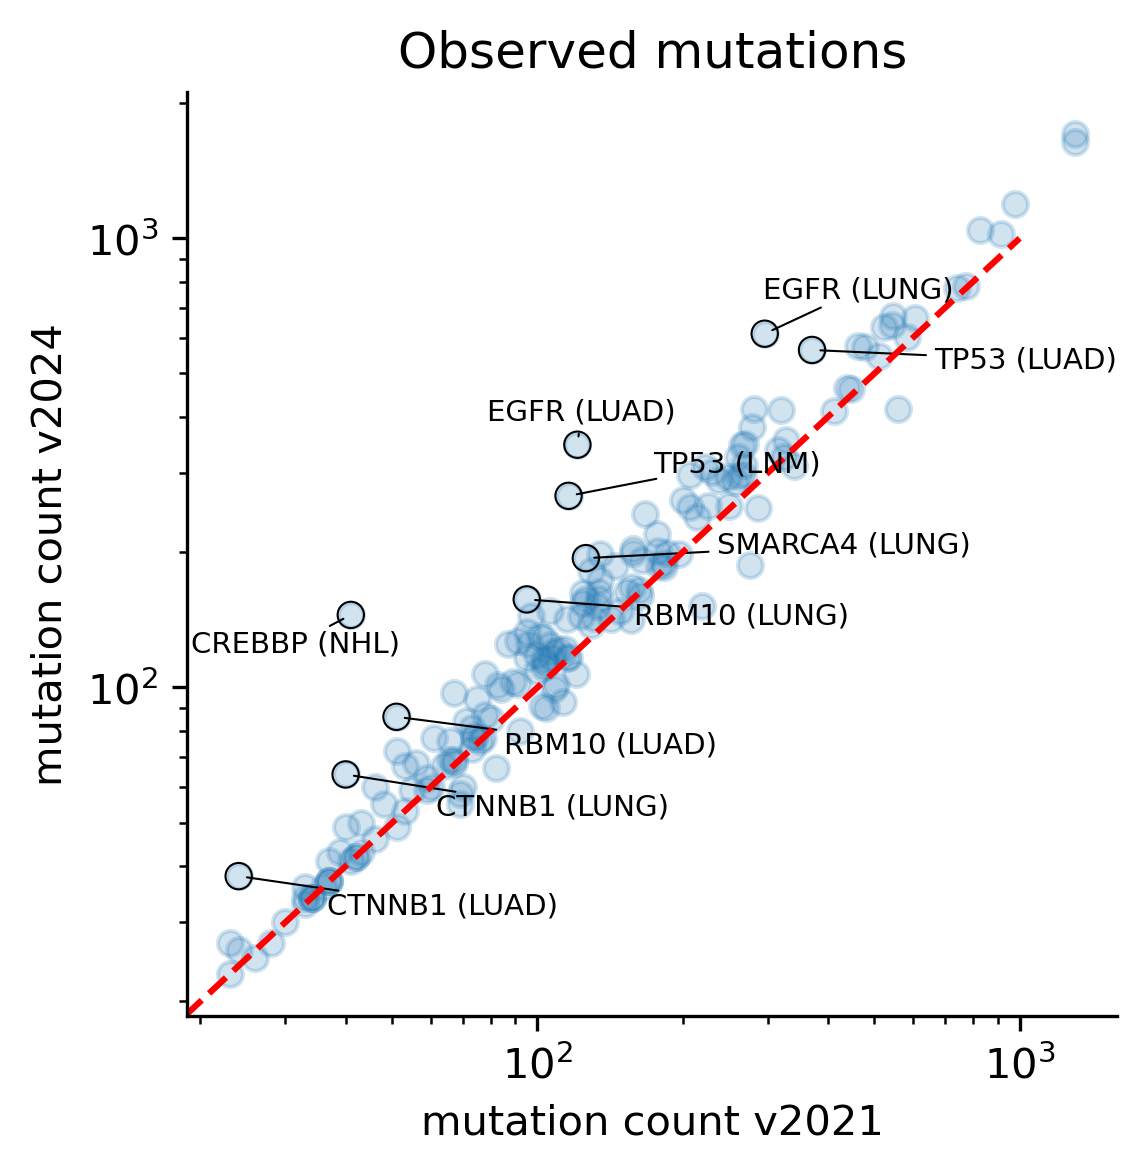
The comparison of observed mutations simply reflects the fact that new mutational cohorts have been added in Intogen v2024, thereby leading to a general increase across all models, given the fact that Intogen v2024 comprises more that 4,000 more samples than the v2021 release. However, with changes in the way mutations are filtered and mapped to a genic region of interest based on MANE Select, there are a few cases where the number of mutations has slightly decreased.
We conducted a comparison of the CV performance between both releases: while the average performance is quite stable across models, there are a few outliers showcasing differences in the modeling outcome, including a few cases for which the performance decreased. As in our original study, we report the CV performance with the F-score50, which gives precedence to precision over recall.
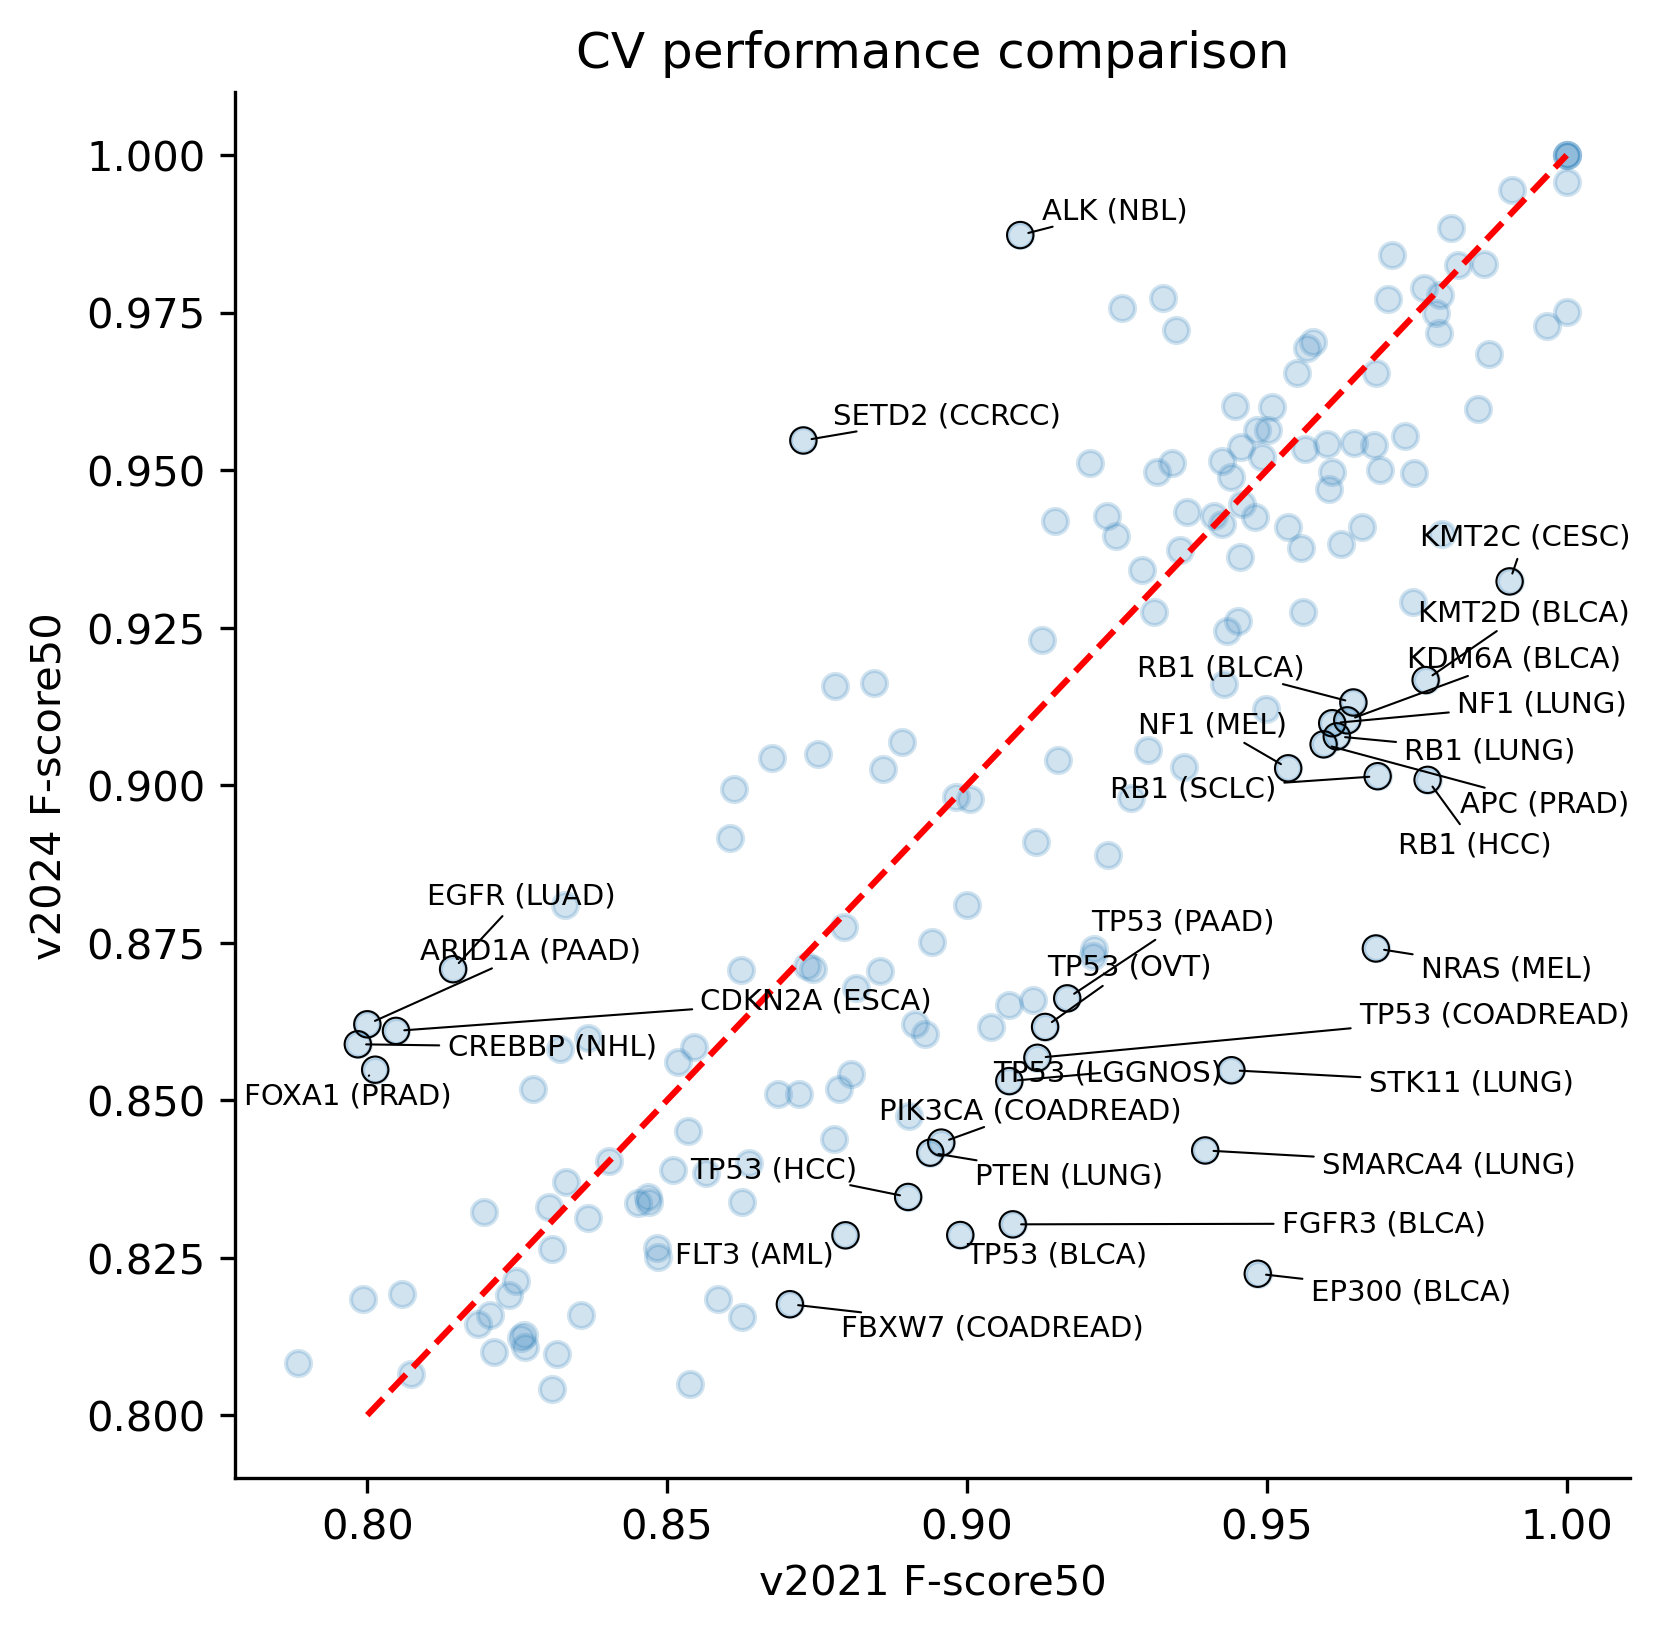
To understand this outcome we must take into consideration that the CV performance can reflect the new models learning more nuanced patterns at training as the mutational catalog gets richer. In particular, larger mutation catalogs come with an increased diversity of passenger mutations making part of the positive set, which constitutes an unavoidable form of data contamination in our methodology. In other words, because our supervised learning strategy uses fuzzy labels based on high dN/dS excess, perfect models are not expected to reach perfect performance.
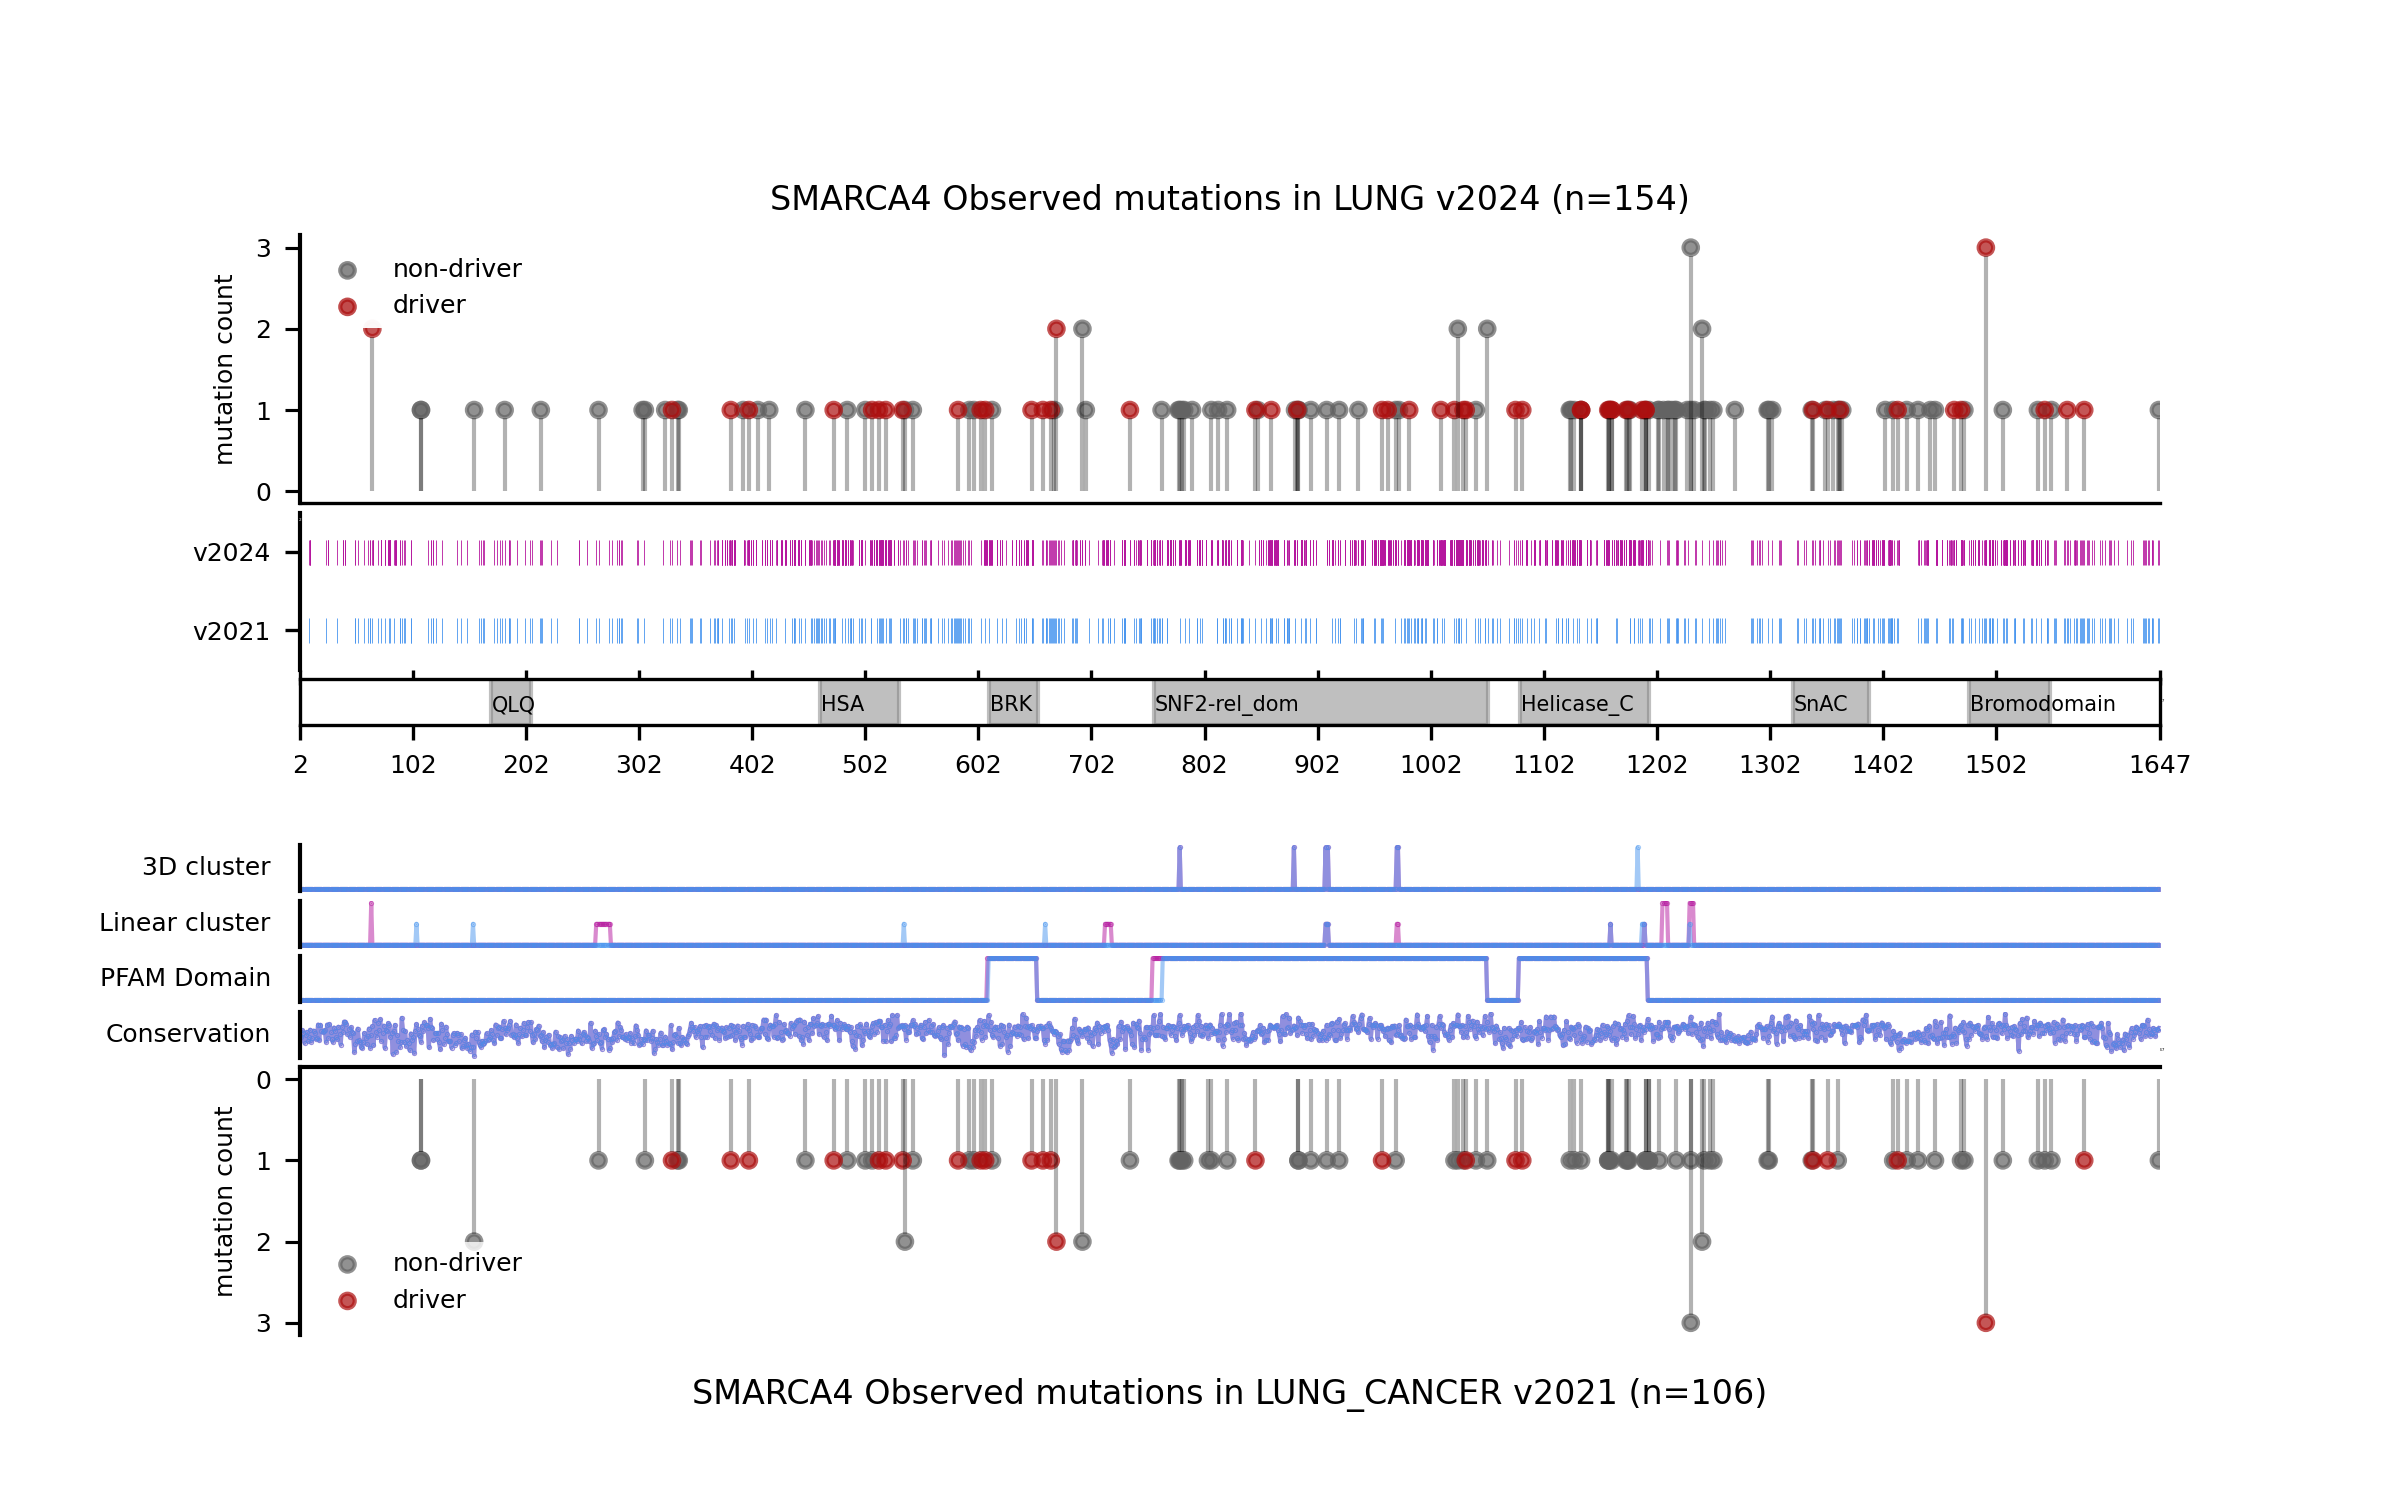
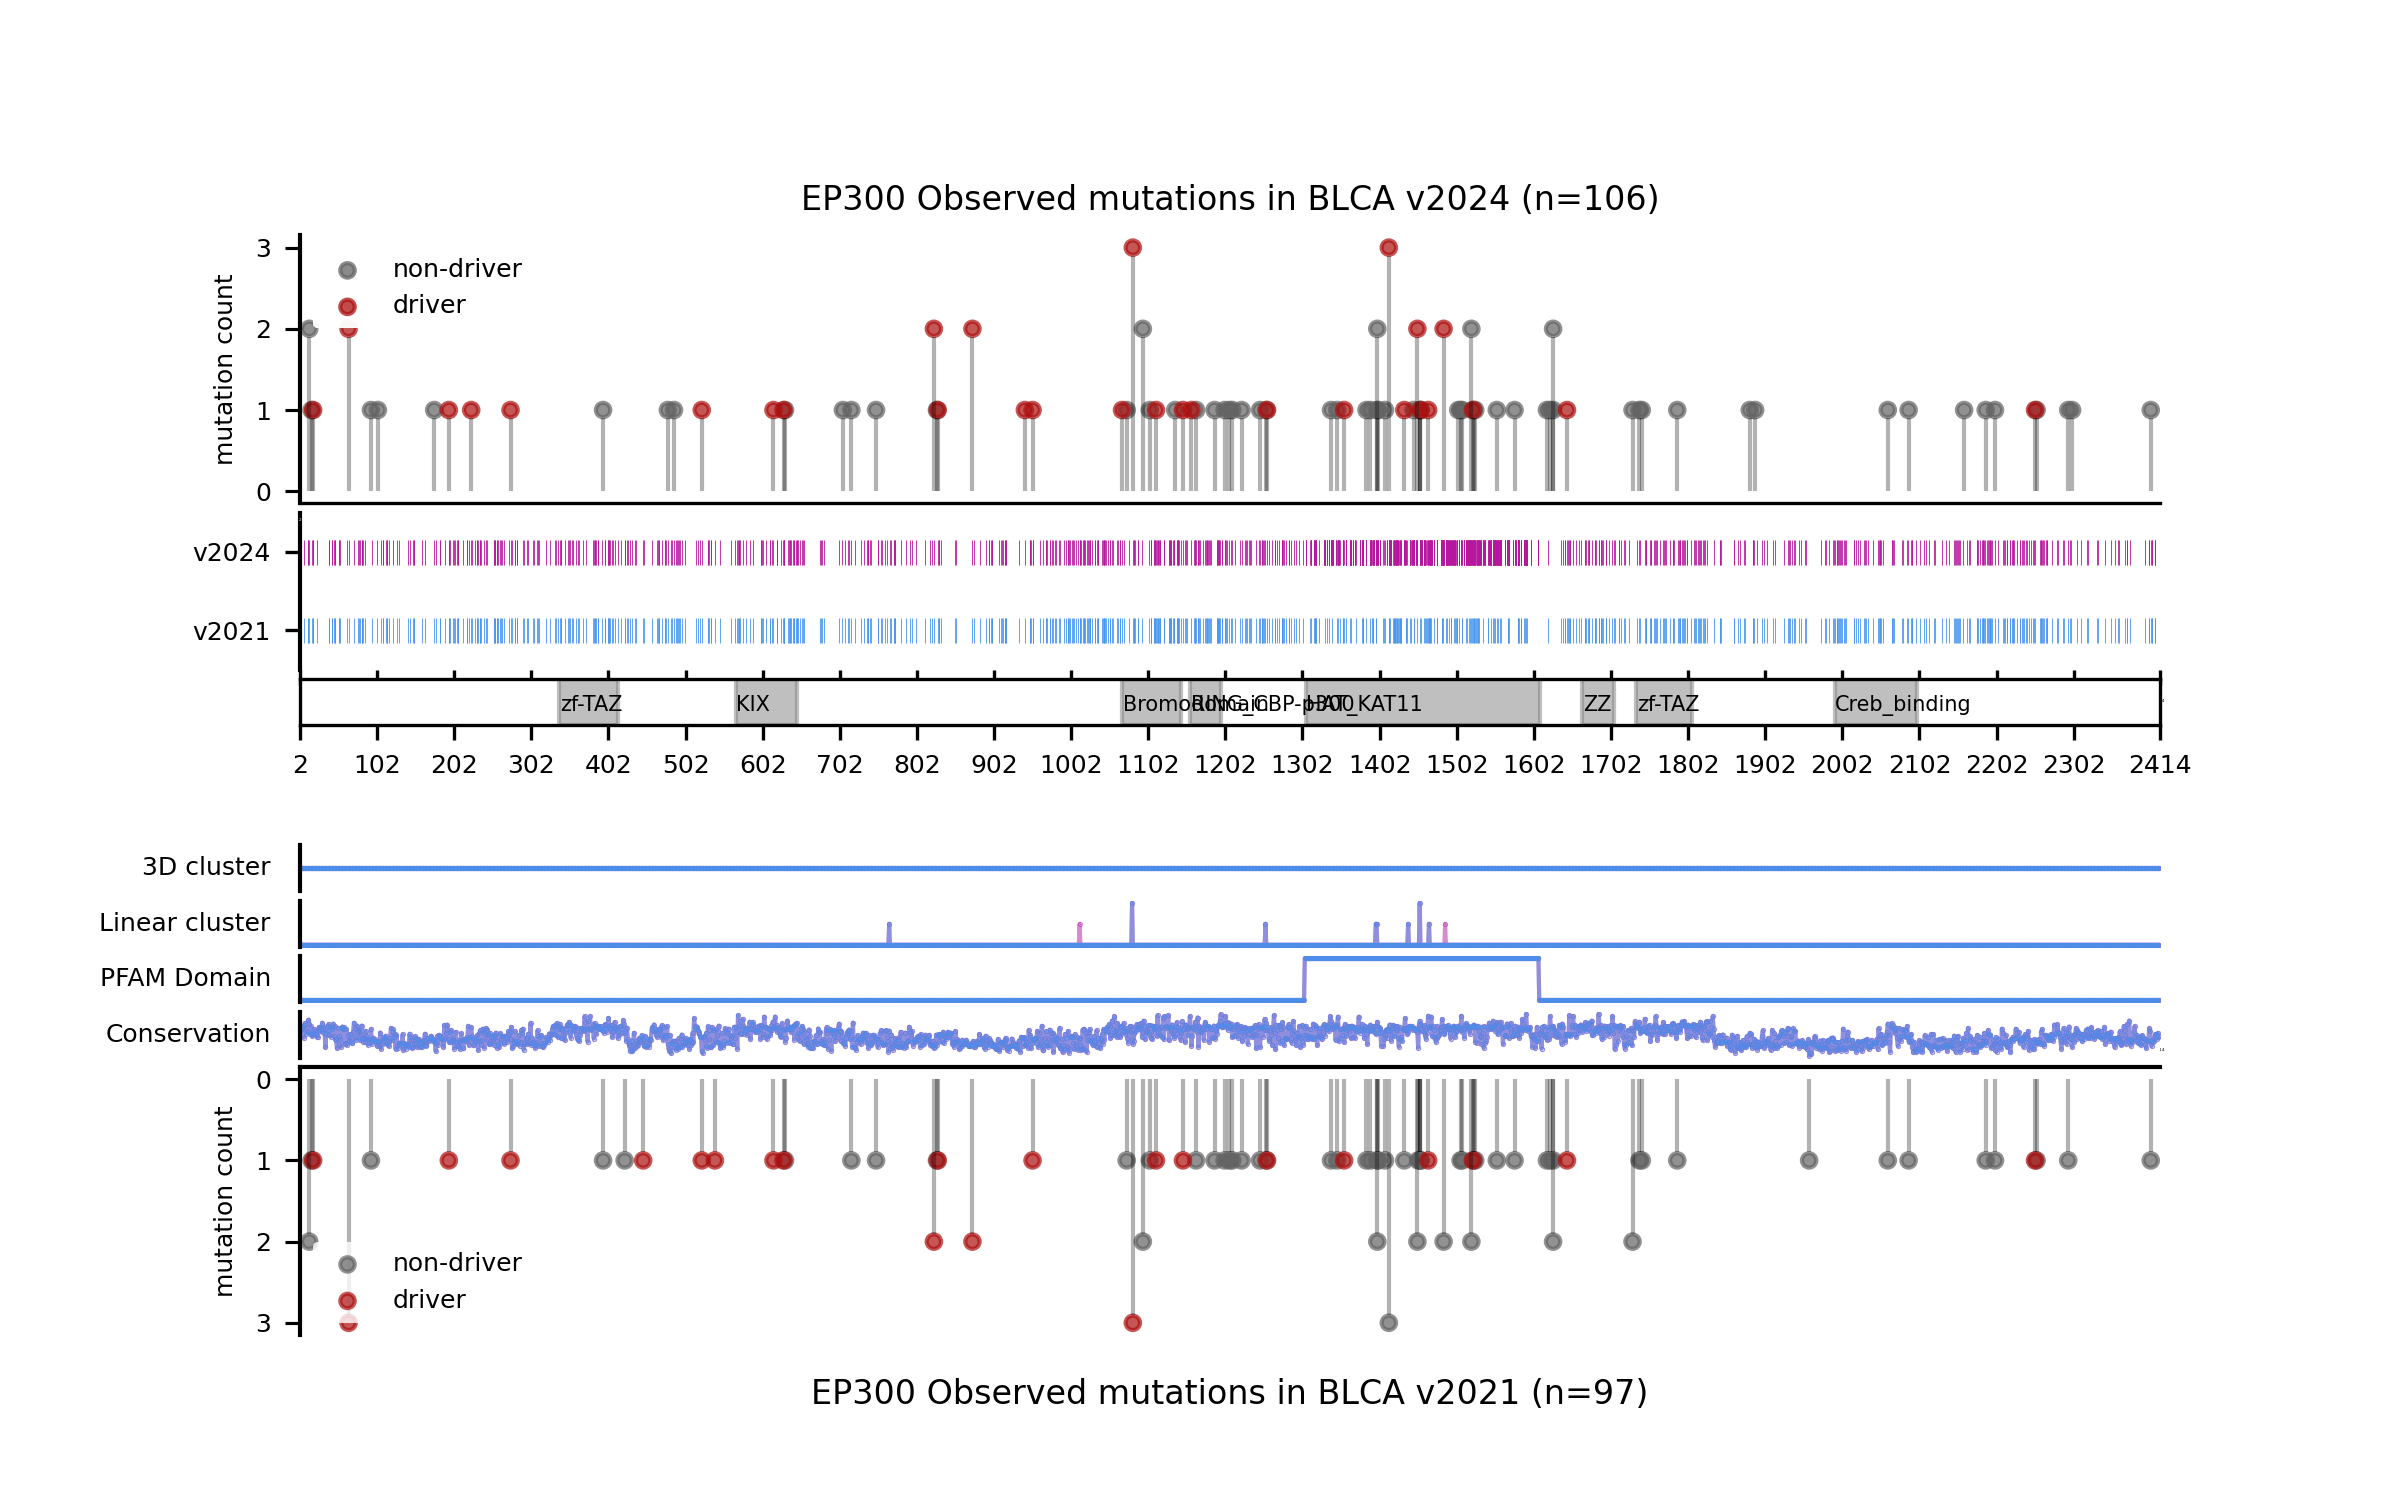
For example, in the cases of SMARCA4 (LUNG) and EP300 (BLCA) we saw that the new models learned more nuanced patterns in the current release. Even though we can see that in these two cases the forecast of the model has not changed, the differences in terms of SHAP values underscore differences in the training outcome across base models. This can be best illustrated by comparing the blueprints and the SHAP feature explanations corresponding to the predictions of observed mutations.
With all this in mind, we also wanted to understand the extent to which models differ in terms of the concordance across comparable genomic sites, regardless of whether there are observed mutations mapping to those sites (in silico saturation mutagenesis). In order to do this, we first mapped the results of the in silico saturation mutagenesis from both releases in the overlap of the regions of interest and computed the concordance as a Matthews Correlation Coefficient (MCC) score between the vectors of binary predictions (blueprints) considering a mutation a likely driver if its boostDM score is higher than 0.5. We also computed the proportion of sites where thus defined drivers were gained or lost.
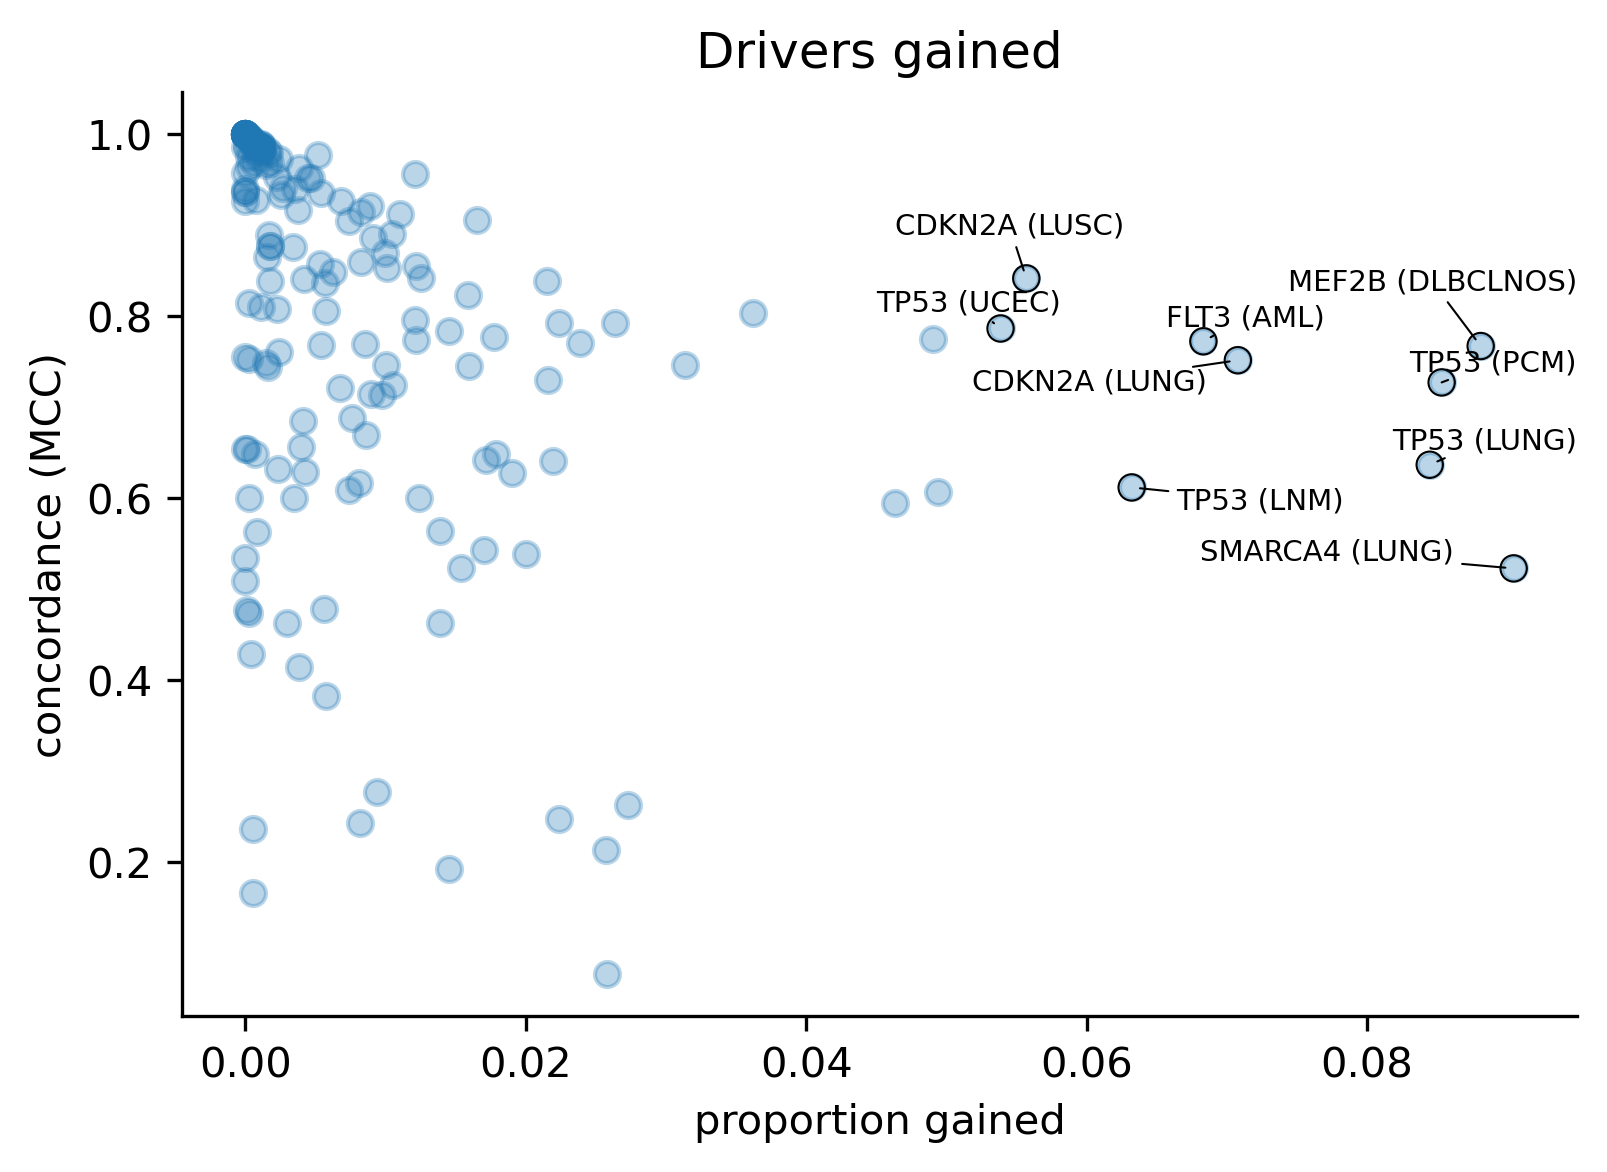
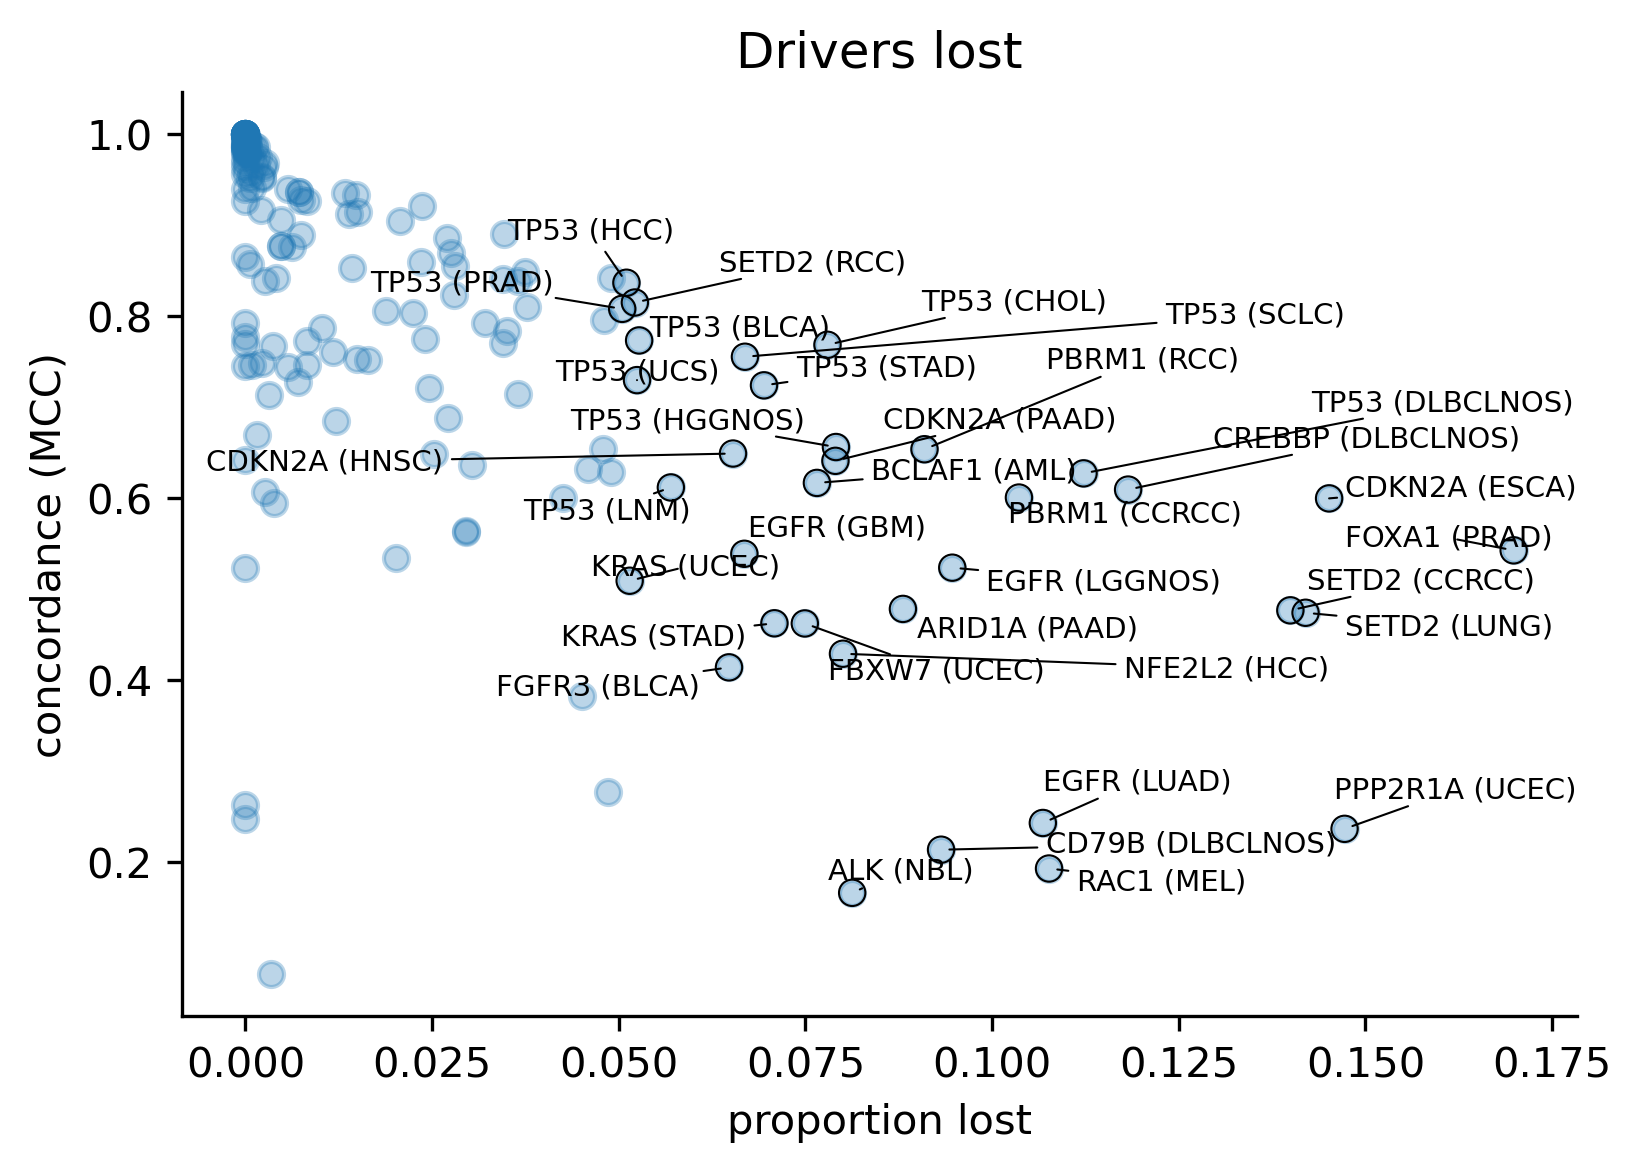
We observe an inverse relationship between the amount of drivers gained or lost and the concordance, which is expected. However, the proportion of drivers gained does not seem to influence the concordance as much as in the cases of drivers lost.
We also asked what is the relationship between the concordance (or lack thereof) and the CV performance of the models in the current release. Interestingly, some models show very little concordance despite the fact that the CV performance in v2024 is very high.
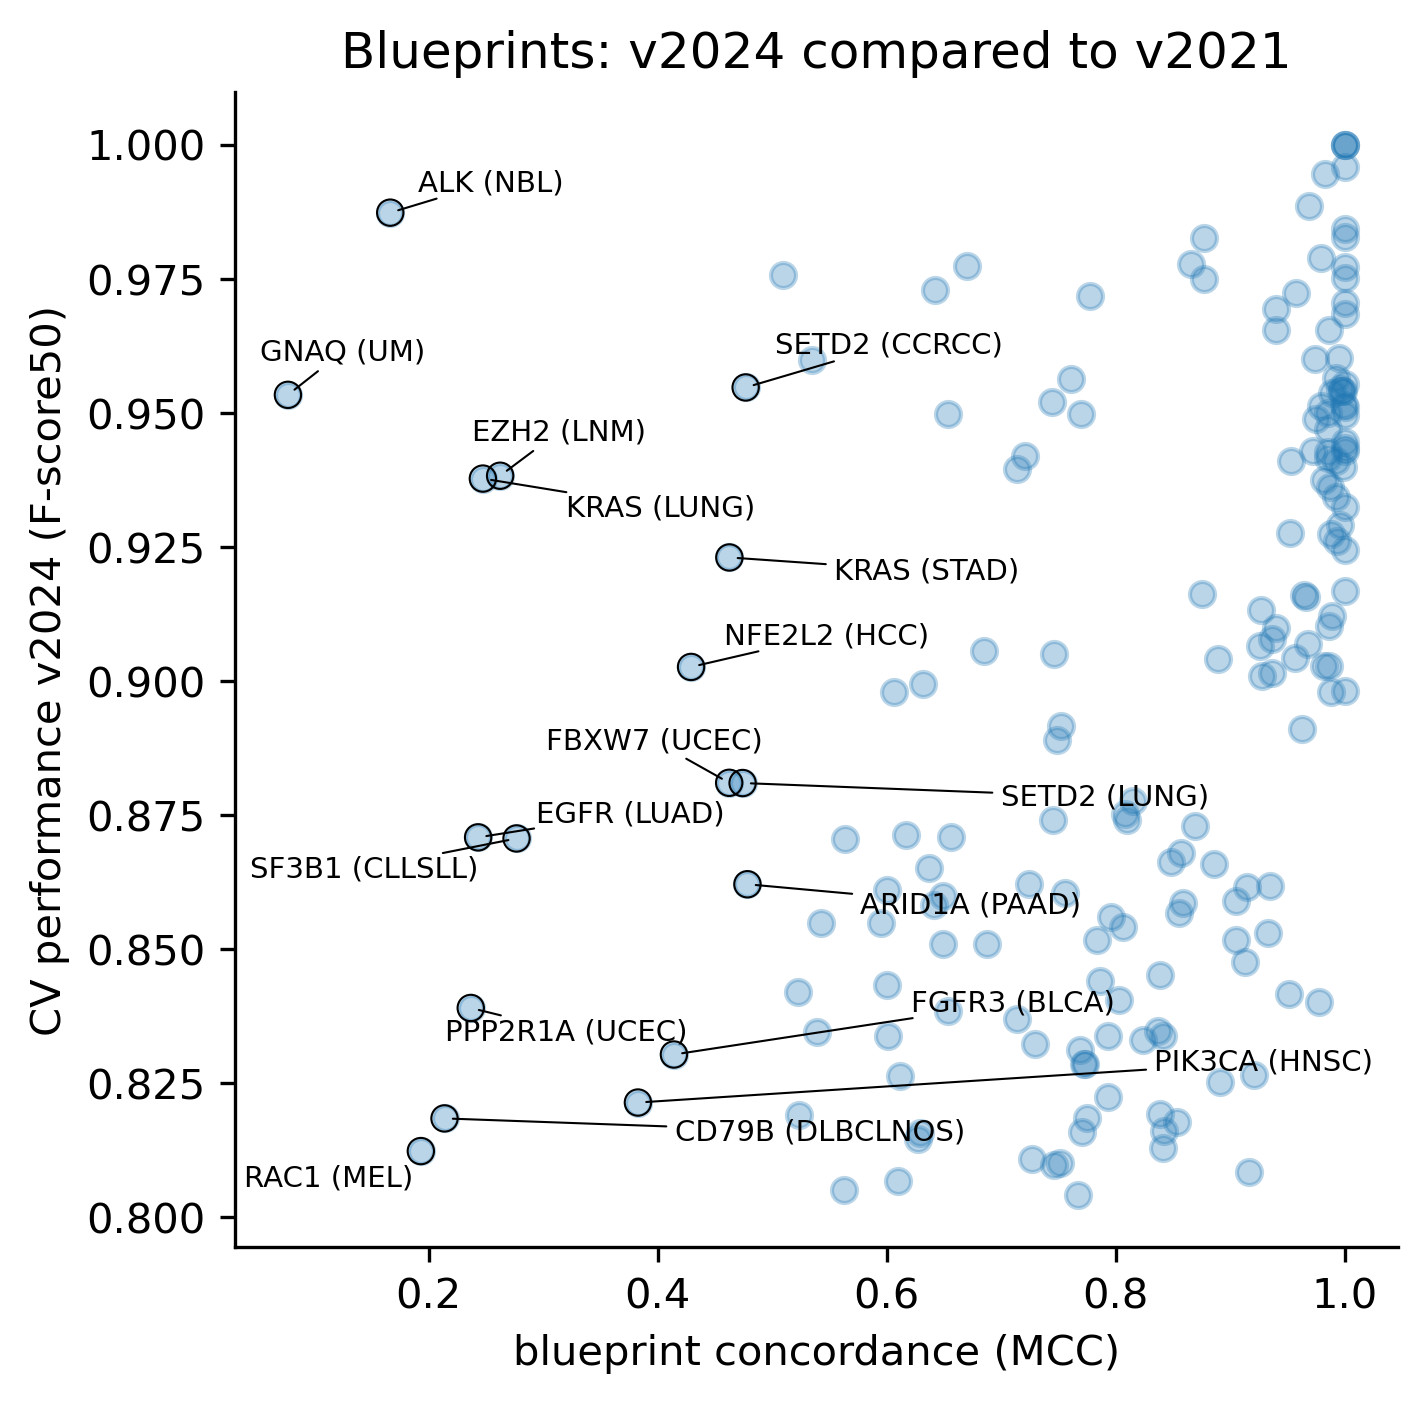
An interesting example is the ALK (NBL) model, where we can see that the former model deemed any non-synonymous mutation in the intracellular kinase domain a driver, whereas the current model casts a much more specific prediction based on the clustering signals of positive selection (see figure in the examples below).
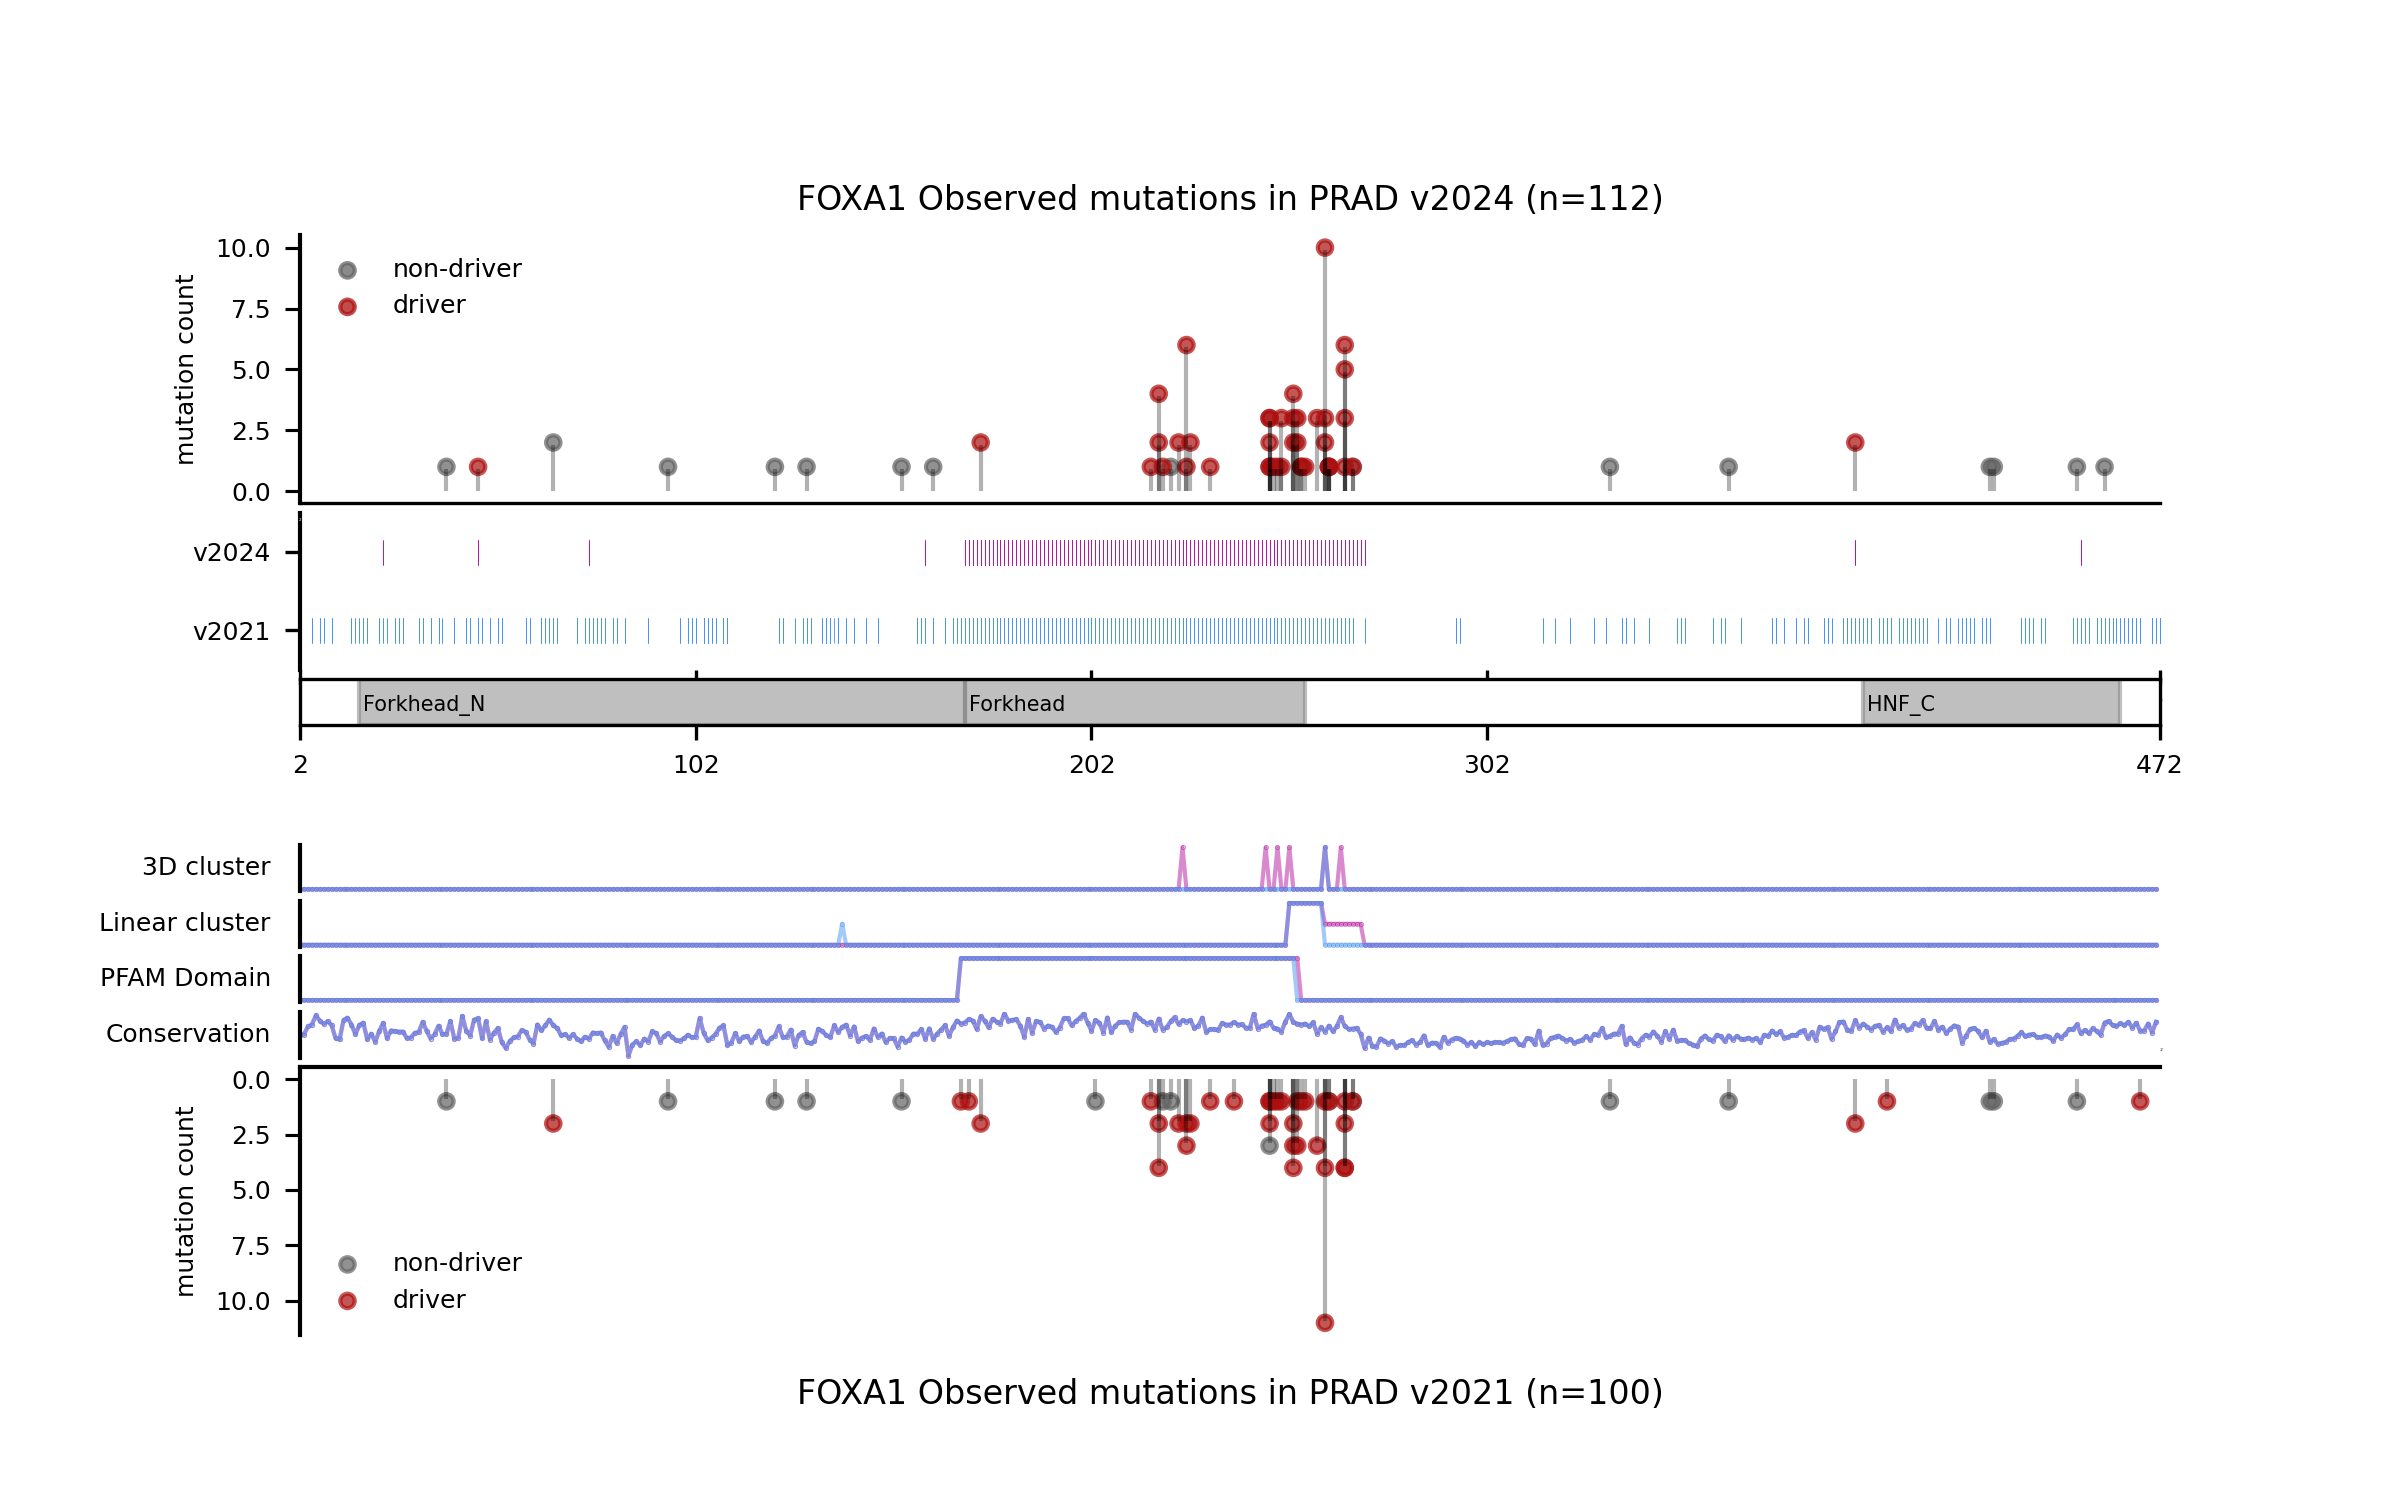
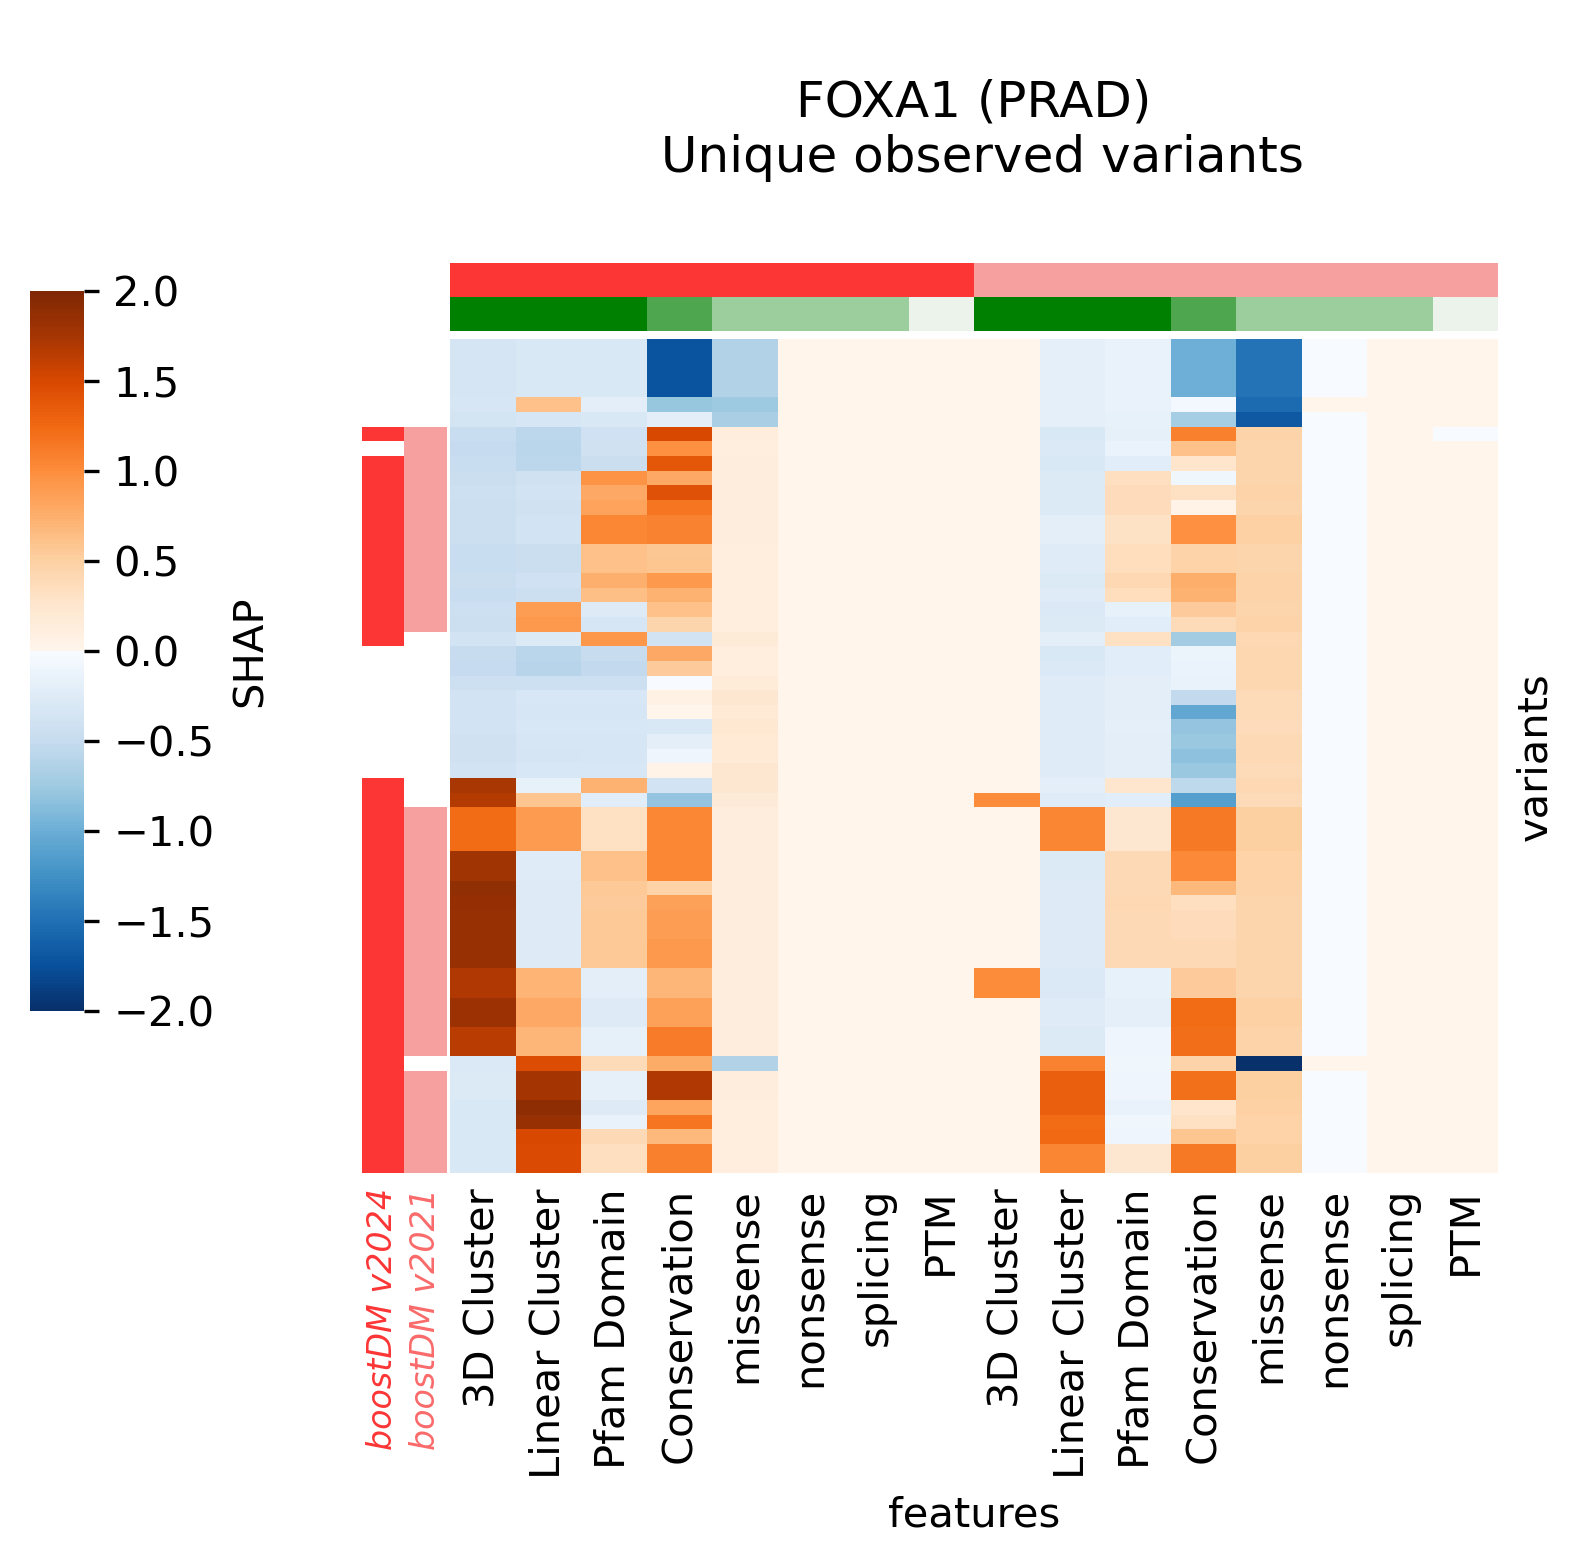
For illustration, we provide a few more examples of gene and tumor type models for which the models have changed sensibly, portraying interesting differences in terms of observed mutations, mutational features, blueprints, and feature explanations.


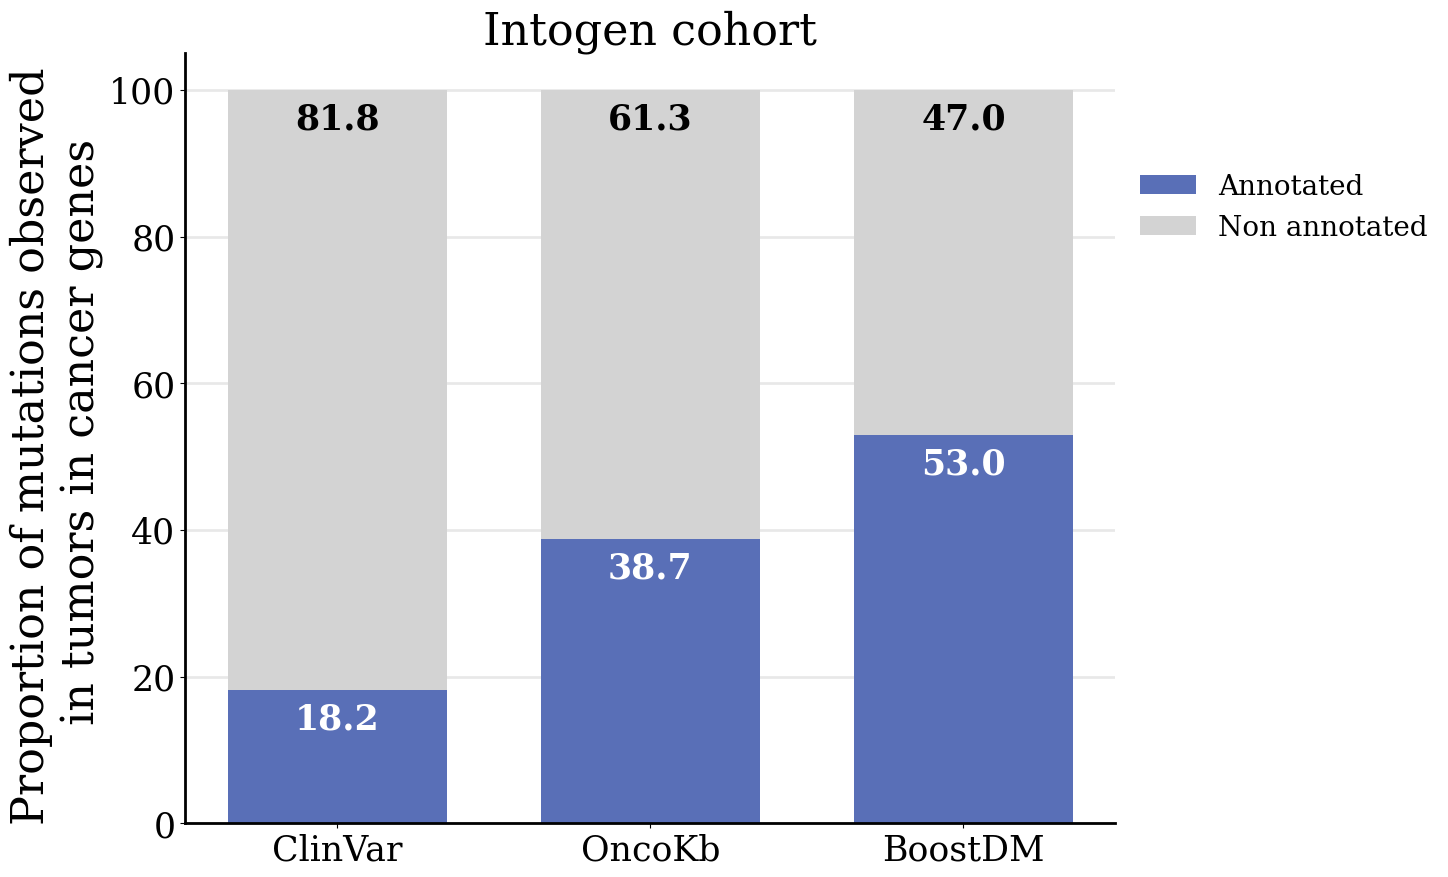
Considering all the models and in silico saturation mutagenesis predictions resulting in the current release, we asked what is the proportion of observed single-nucleotide variants for which there is an annotation as either pathogenic/oncogenic or non-pathogenic/non-oncogenic at well-known databases of clinical annotations and compare this with the proportion attained by boostDM models. For this exercise we used ClinVar (version from 2024-03-31) and OncoKb (obtained using API version v1.4.1 and data version v4.19) as reference datasets of clinical annotations. We conducted this analysis using observed mutations from the Intogen (v2024) and from the GENIE cohort (v15.1).

In view of the significant fixes and updates in the making of boostDM models, we conducted some benchmarking analyses similar to those accompanying the first release of the method doi.org/10.1038/s41586-021-03771-1. In our analyses, we included additional experimental saturation mutagenesis datasets and new bioinformatic scores retrieved through dbNSFP. Some of these datasets and scores have been made available only recently, adding value to this benchmarking exercise.
We collected some experimental saturation mutagenesis assays whereby the fitness and/or functional impact of mutations at certain human genes has been put to test in highly multiplexed experimental setups where many of these variants were tested at once.
We have also taken advantage of a collection of bioinformatic scores aiming to measure the pathogenicity or functional impact of variants for comparison against boostDM. Although most of these tools were not designed specifically to measure the likelihood of the variants to be under positive selection in the context of somatic evolution, all these scores are relevant and have been used in cancer genomics related studies and methods.
Whenever a new classification score of variants is proposed it is always convenient to evaluate how this new method compares with other scoring methods on an evaluation set that reflects the ground truth and guarantees that none of the methods has an artificially inflated performance. Typically one would like to compare against methods intended to solve the same problem. Even the experimental saturation mutagenesis assays that assess the effects of mutations in experimental systems (cell lines or mice) do not necessarily test their oncogenic effect in the human organism. This is why we want to compare the performance of boostDM models, experimental saturation mutagenesis, and bioinformatic tools against ground truth labels built upon observed and synthetic mutations.
Here we take as ground truth driver mutations the mutations that have been observed in cancer genes across human tumors and which have a consequence type with high enrichment in driver mutations – asserted from dN/dS analysis. In particular, this set might include some non-driver mutations. On the other hand, synthetic mutations generated following the mutational profile of neutral mutagenesis across samples in the same tumor type constitute a good approximation of the set of passengers. In order to build a good evaluation set, we considered mutations in the test sets held out from training across boostDM base classifiers as drivers (observed in high dN/dS consequence type context) and nondrivers (synthetic mutations generated in accordance with the background mutational profile). The evaluation set is built by taking all the mutation instances from the testing splits at each base classifier, with each mutation annotated with their mutational features, the boostDM score cast by the corresponding base classifier and the driver/nondriver ground truth label.
We built an evaluation pool by taking all the mutations from the testing splits of each base classifier, each mutation annotated with their mutational features, the boostDM score cast by the base classifier and the driver/nondriver ground truth label. By using held-out testing mutations and base classifiers as predictors we reduce the leakage at prediction time for the sake of an unbiased evaluation.
On the one hand this evaluation strategy is expected to still bear some information leakage because we do not completely overrule the possibility that a mutation used at training is present in their corresponding testing splits, but we enforce that if this happens the mutation has unique instance in the test set, i.e. we drop duplicates in the test set. On the other hand, our evaluation strategy makes use of the suboptimal predictions cast at the base classifier level (before aggregation of the base classifiers into a consensus model) which would play against performance inflation.
We mapped all the scores to be tested onto the evaluation set, and assessed the performance of each against the ground truth labels by computing the precision recall curves, given the fact that none of the scores admitted a clear cut dichotomic interpretation as they are given as continuous numerical scores.
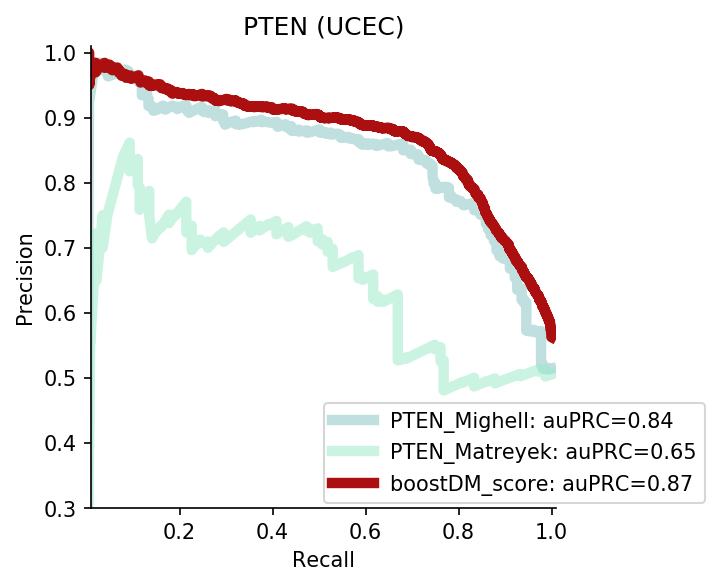
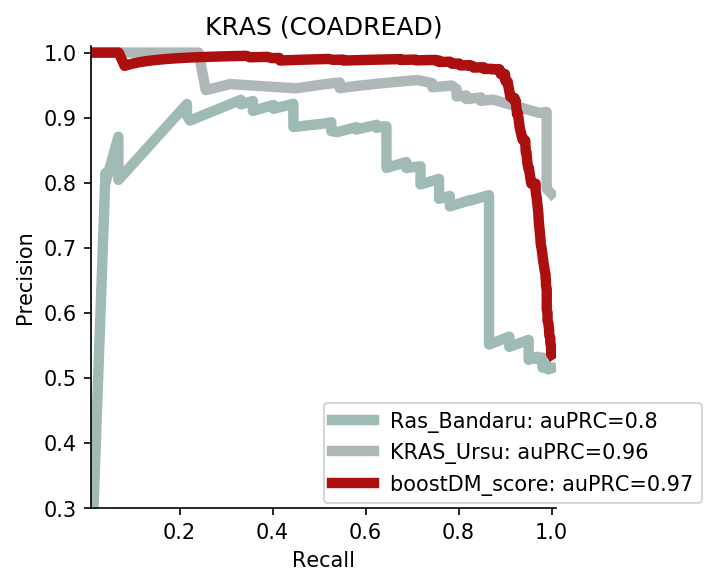
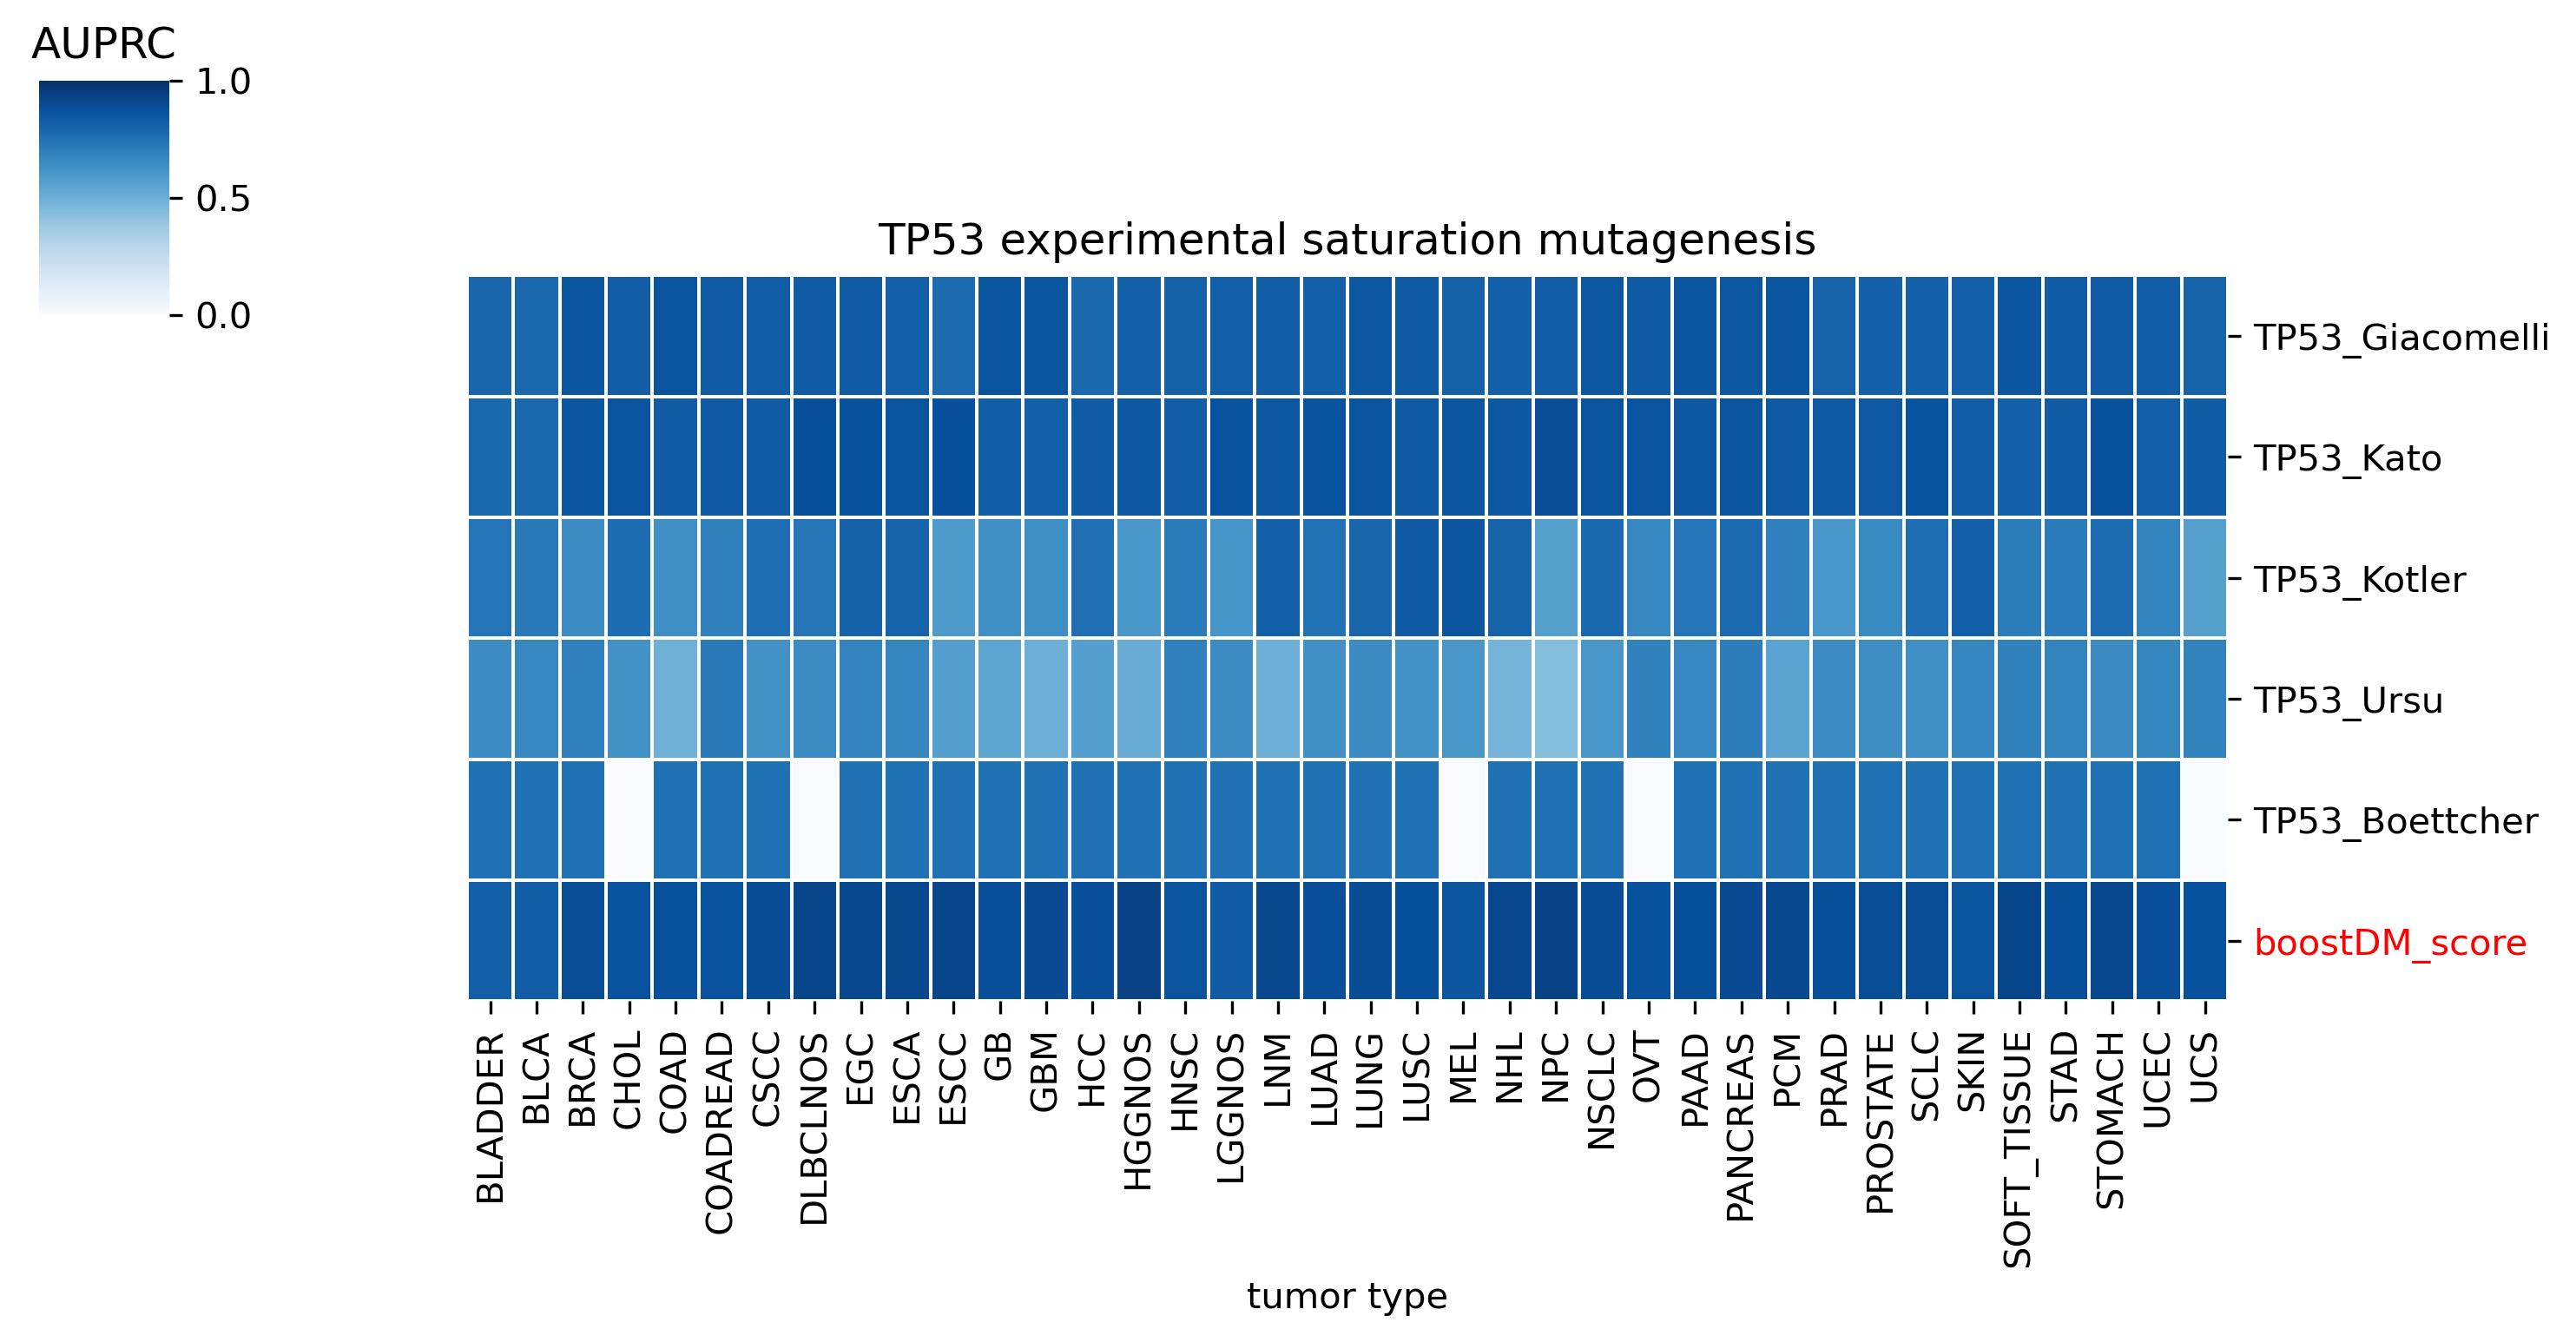
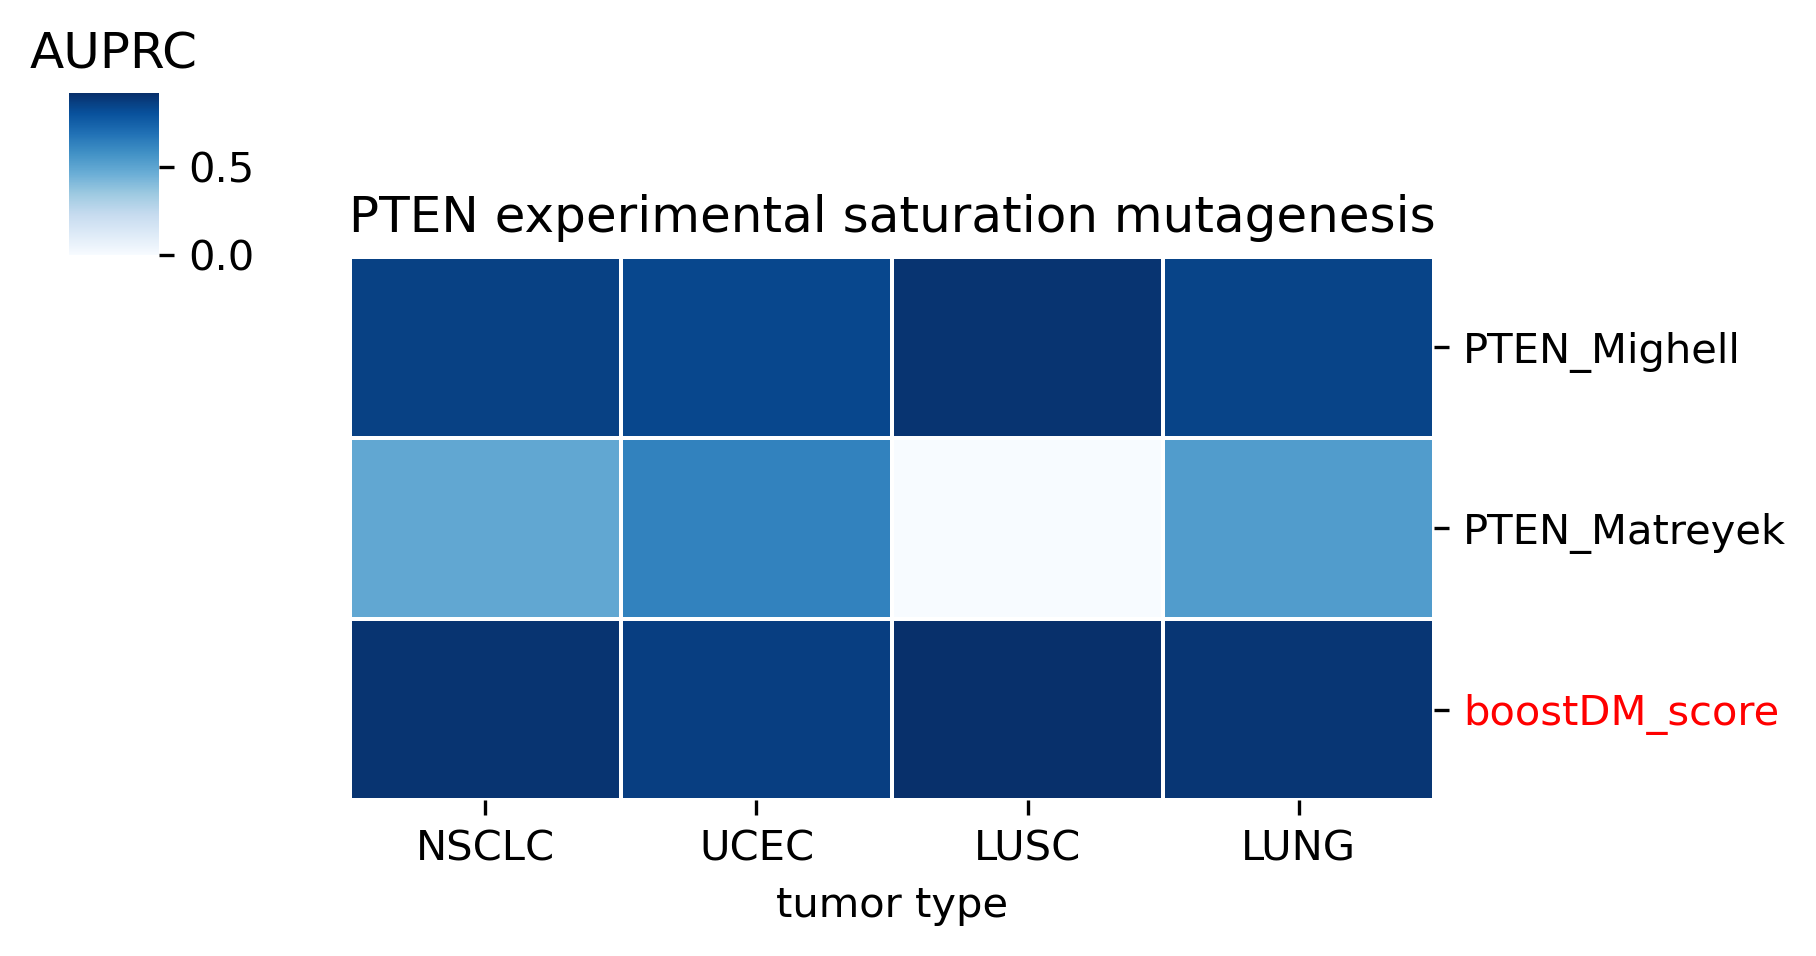
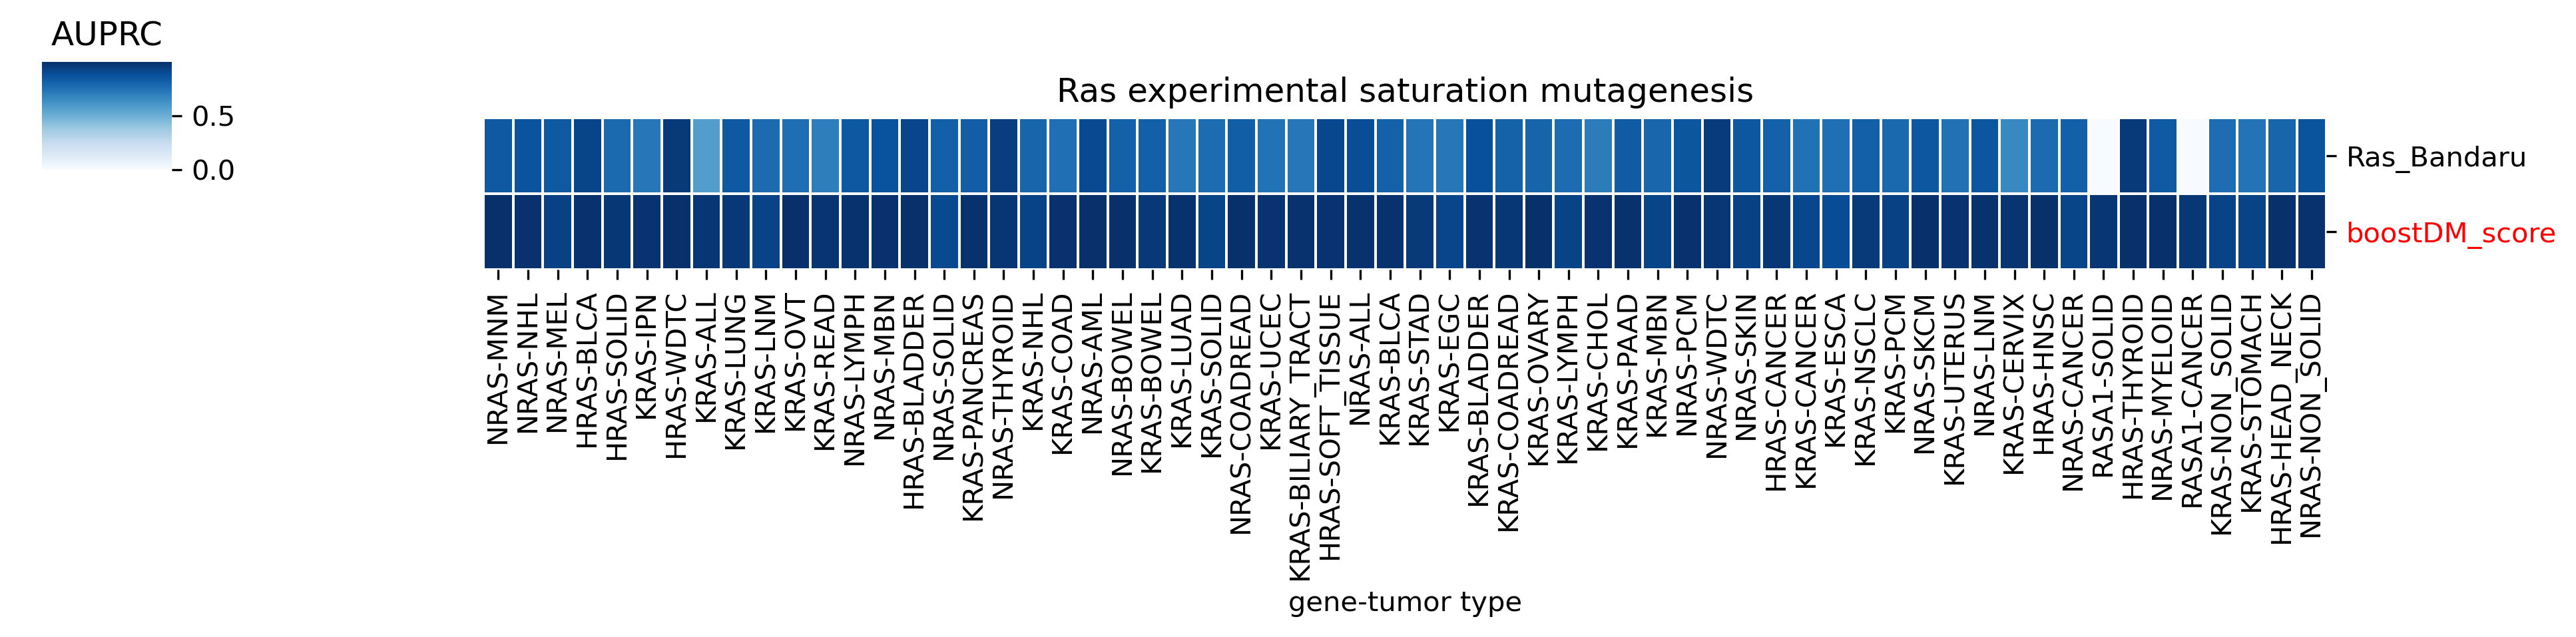
The comparison of boostDM against experimental saturation mutagenesis assays in TP53, PTEN and Ras genes was robust in general, with only a few instances where the number of mutations in the comparison set was deemed insufficient to draw any conclusions. We conducted the benchmarking exercise across the high-quality models of TP53, PTEN and Ras genes (HRAS, KRAS and NRAS). Note that some experimental saturation mutagenesis datasets cover only a subset of the mutations considered in the region of interest of boostDM (e.g. restricted to a domain or to missense mutations), hence we carried out the evaluation only on the intersection with the evaluation set, making sure to keep the driver and nondriver labels balanced by randomly pruning the evaluation set if necessary.
In general, boostDM performs similarly or better than the experimental saturation mutagenesis scores at the task of discriminating between driver and nondriver mutations, which is in accordance with the results obtained with the previous release v2021.
Due to the fact that our methodology uses different testing sets for each gene and tumor type combination, the evaluation of experimental saturation mutagenesis assays might change depending on the tumor type. Even if the score yielded by the assay and used throughout the testing is the same across models for a given gene, the fact that the observed and randomized mutations in the test set are not the same implies that there will be some differences. Whether these differences are biologically meaningful is something we must be looking into in the future.

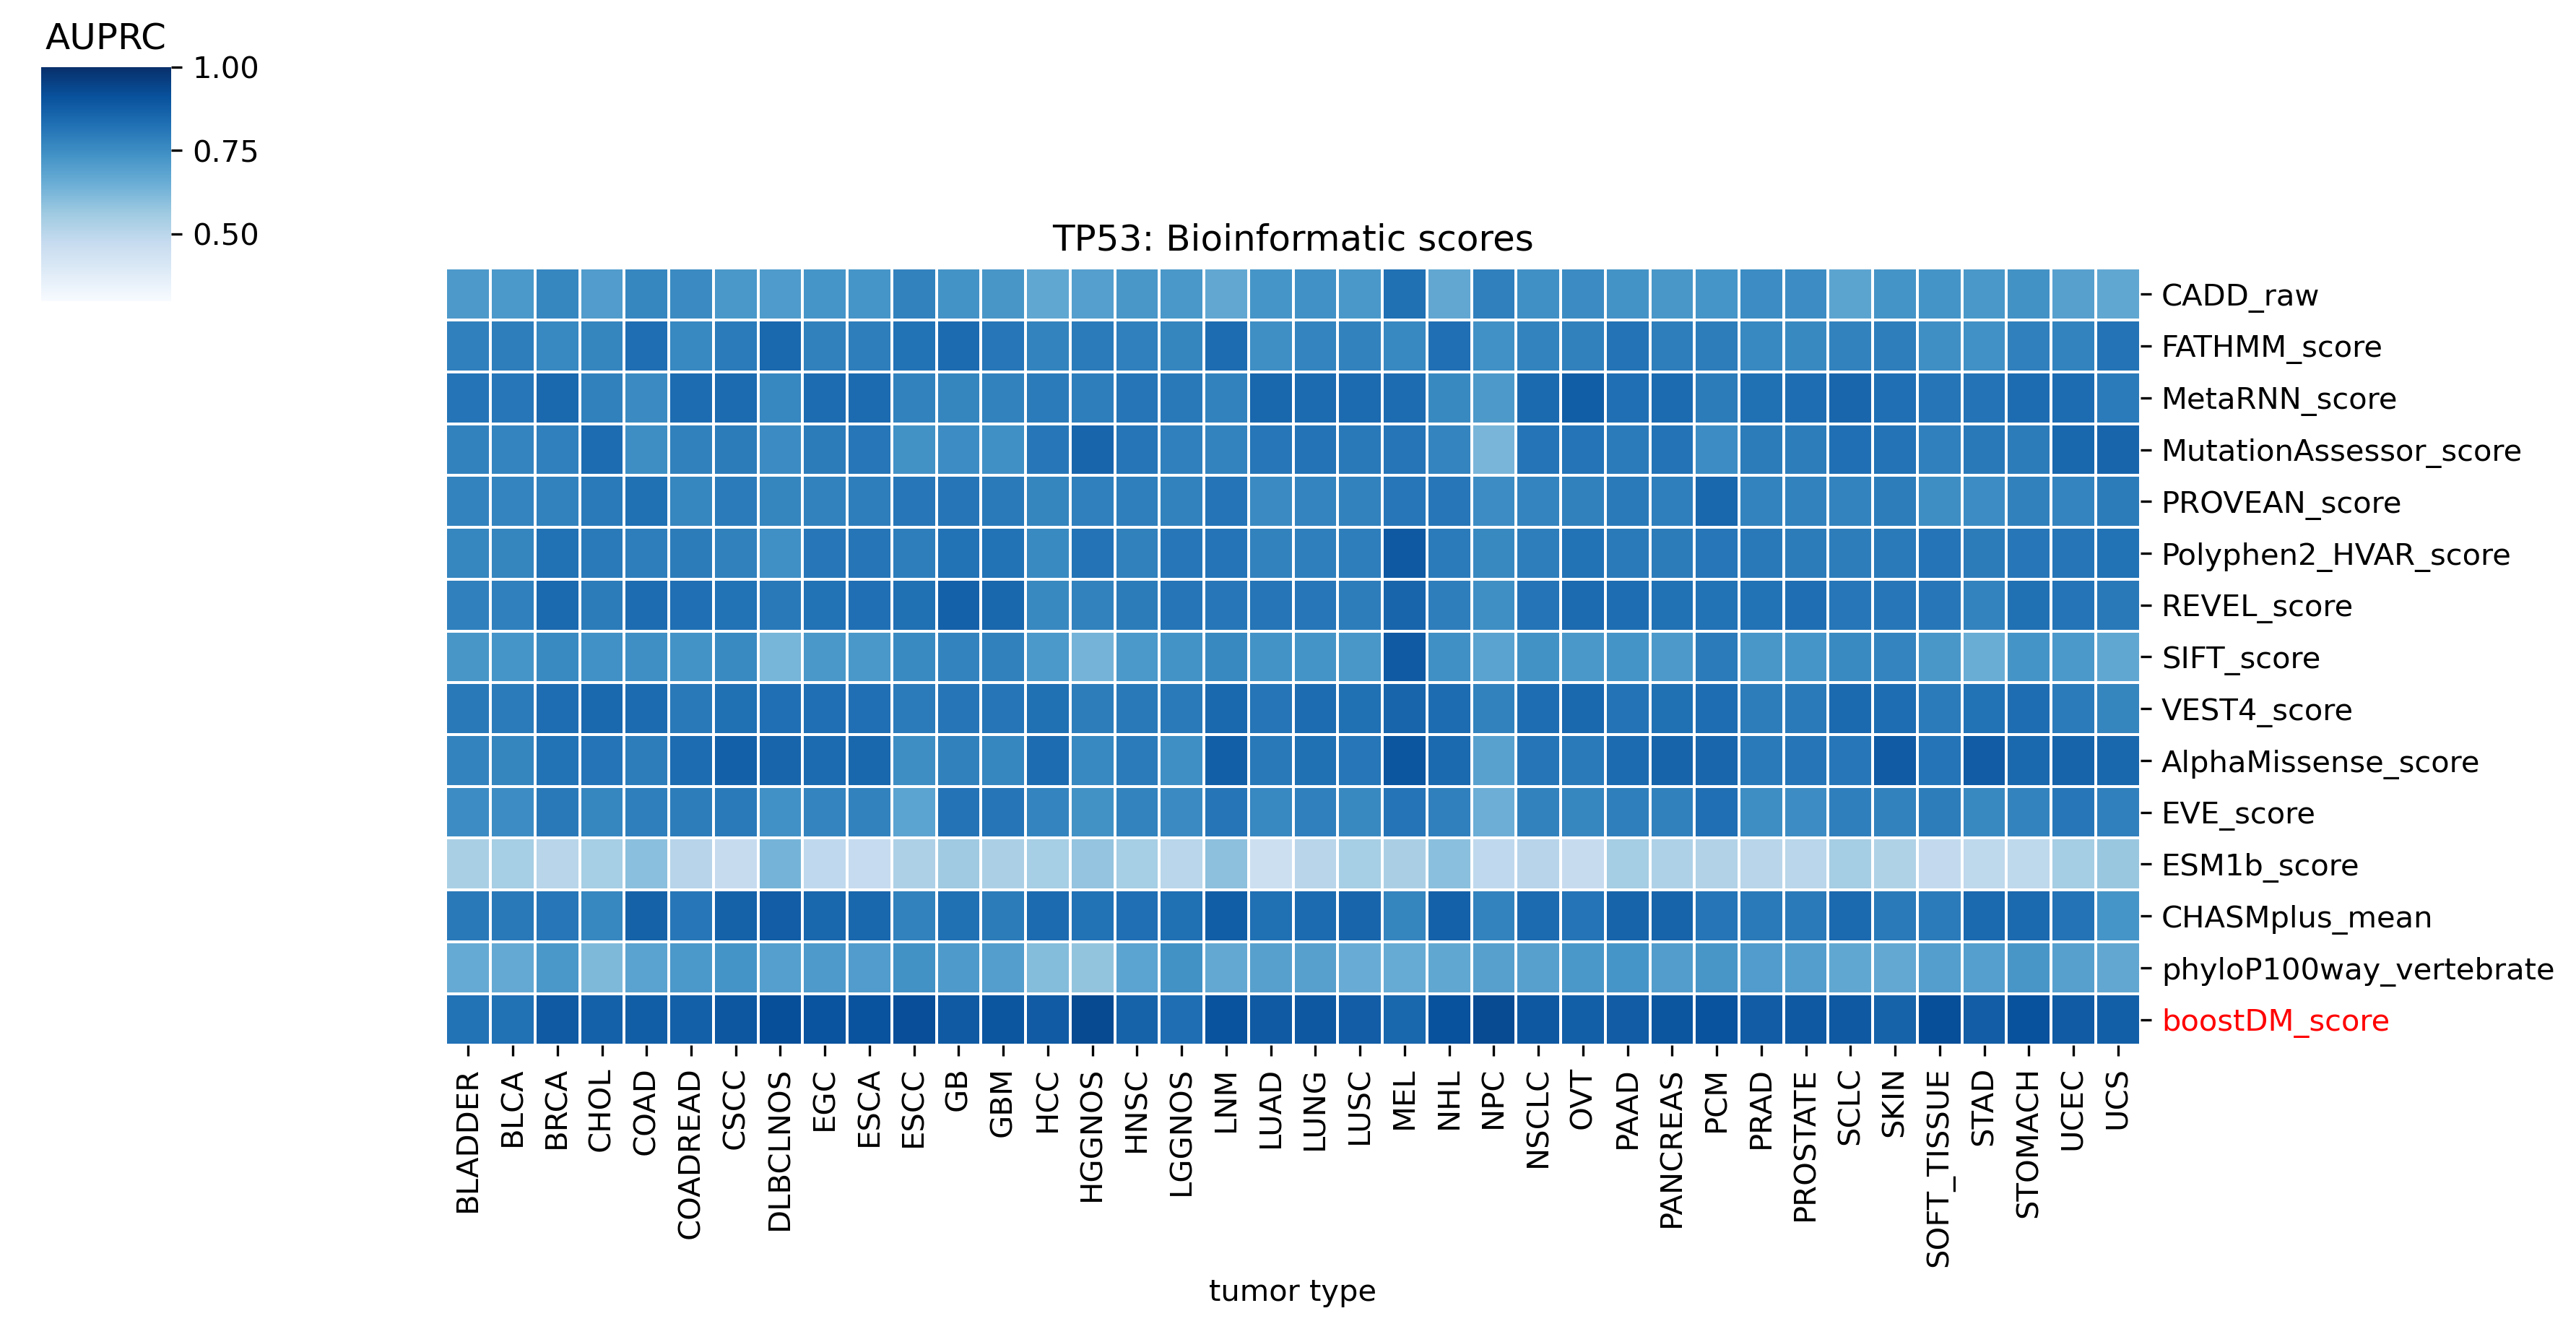
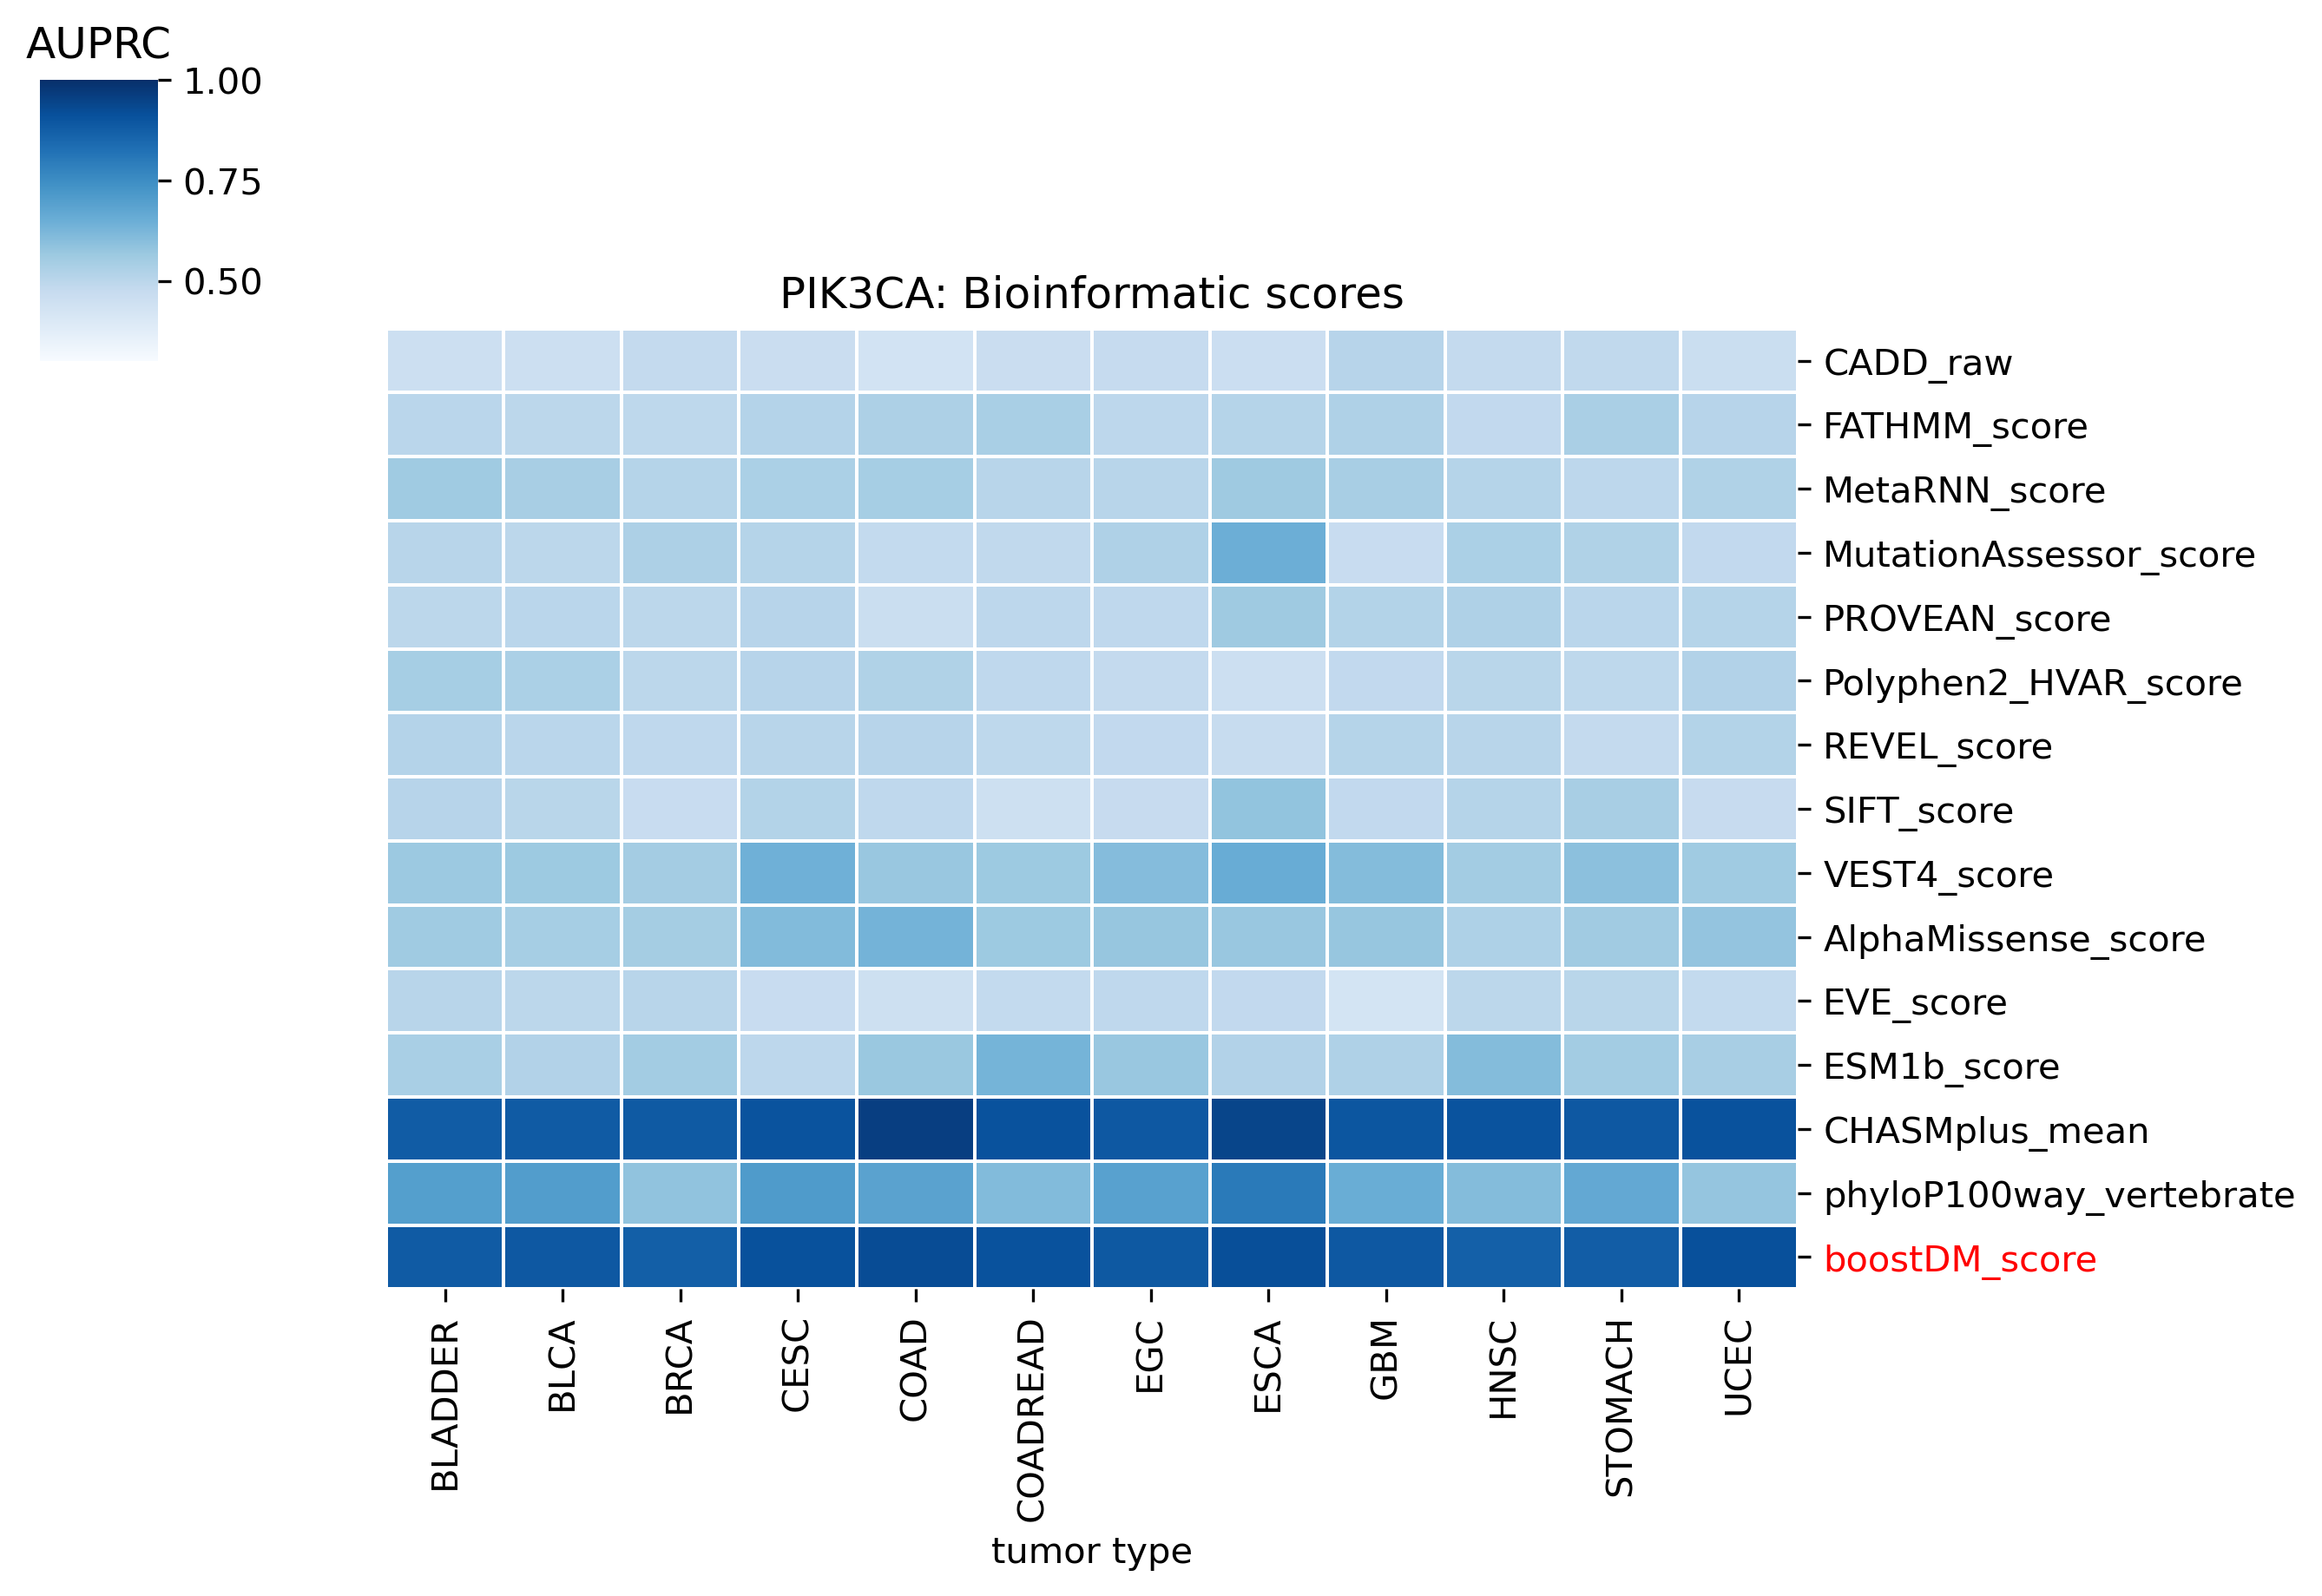
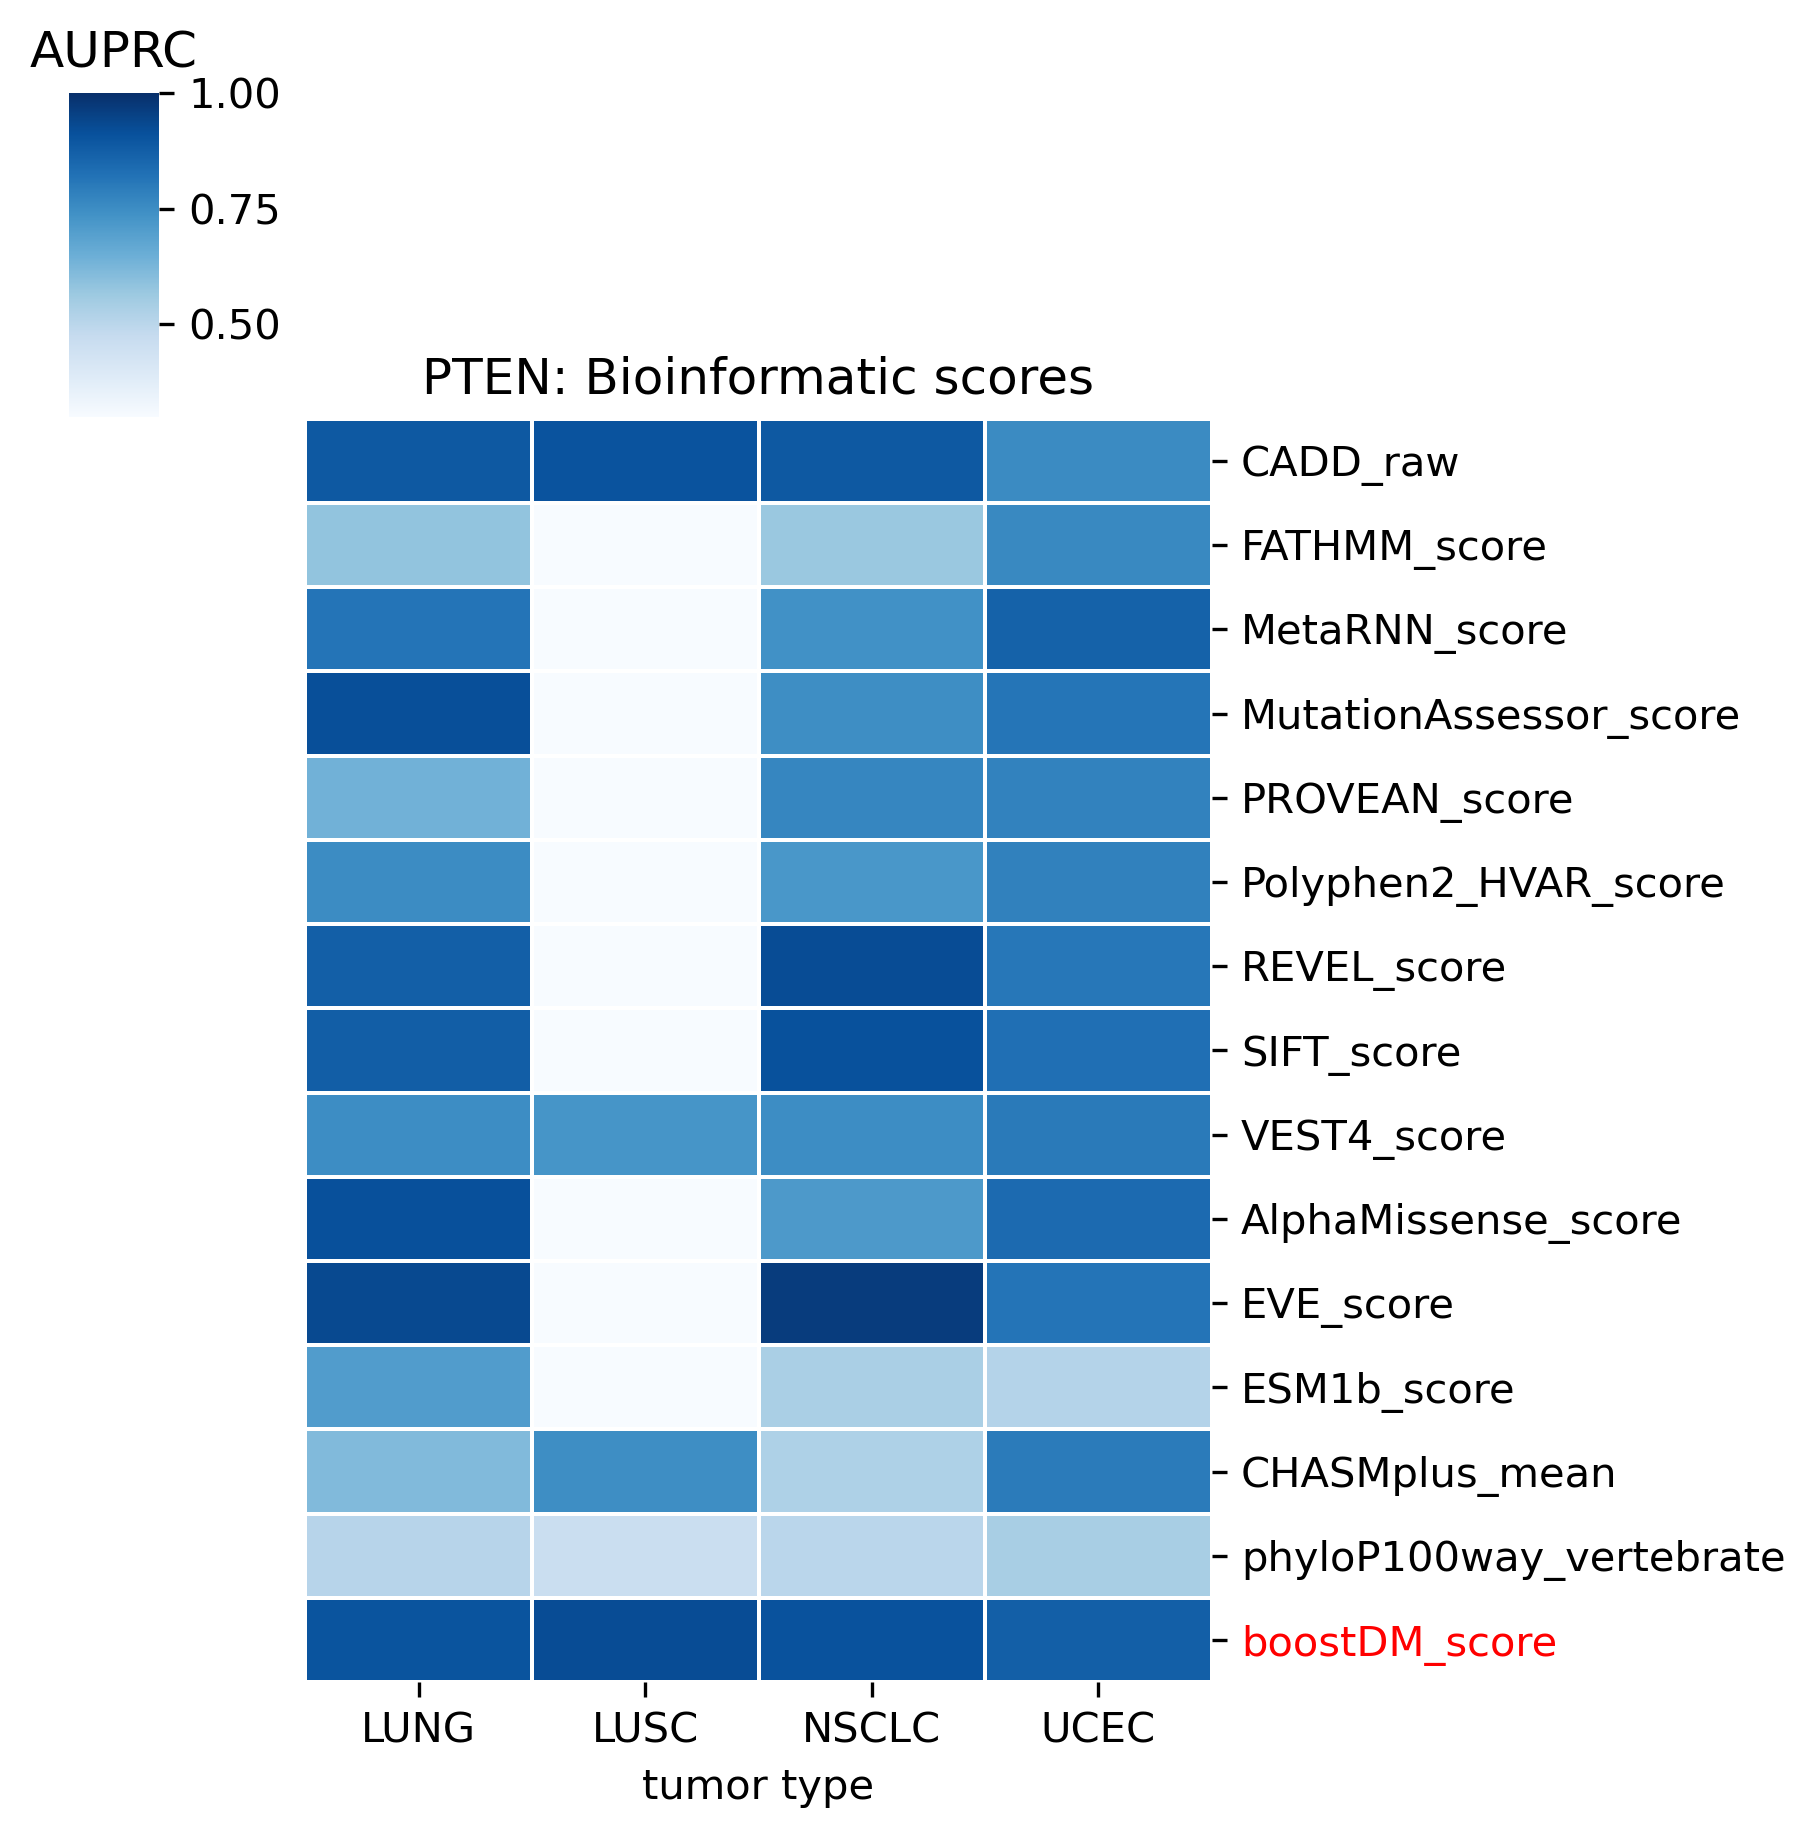
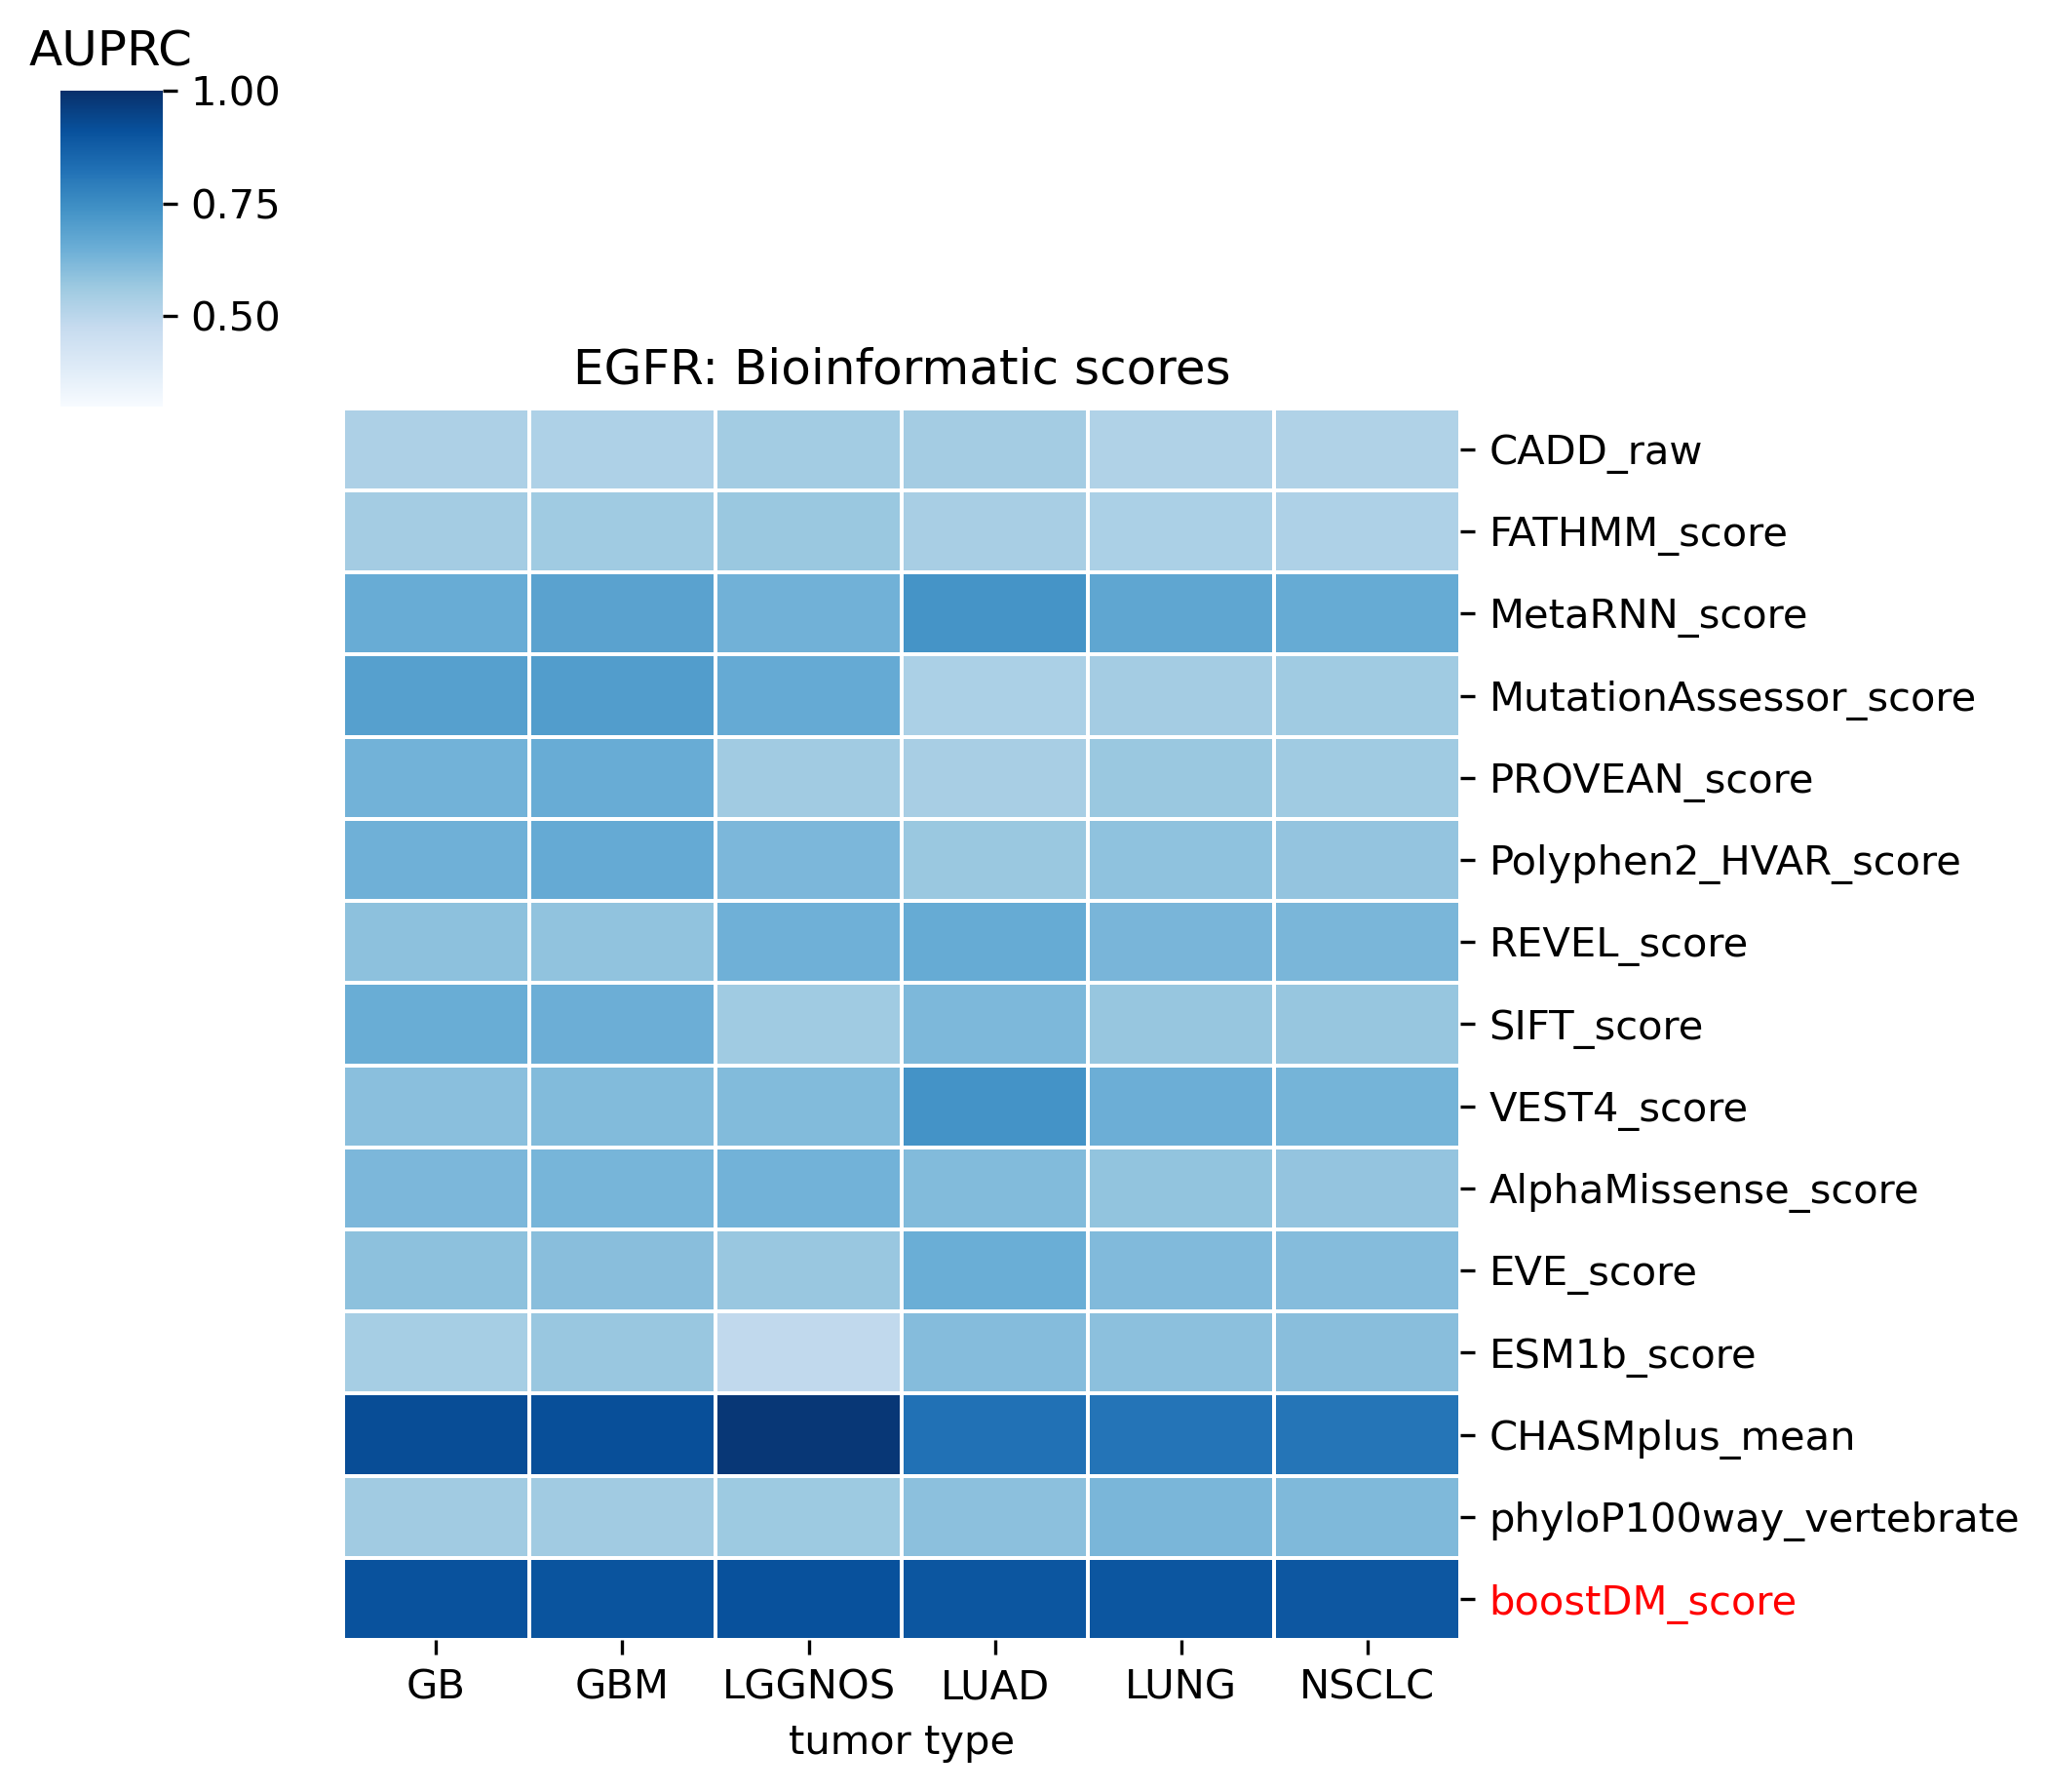
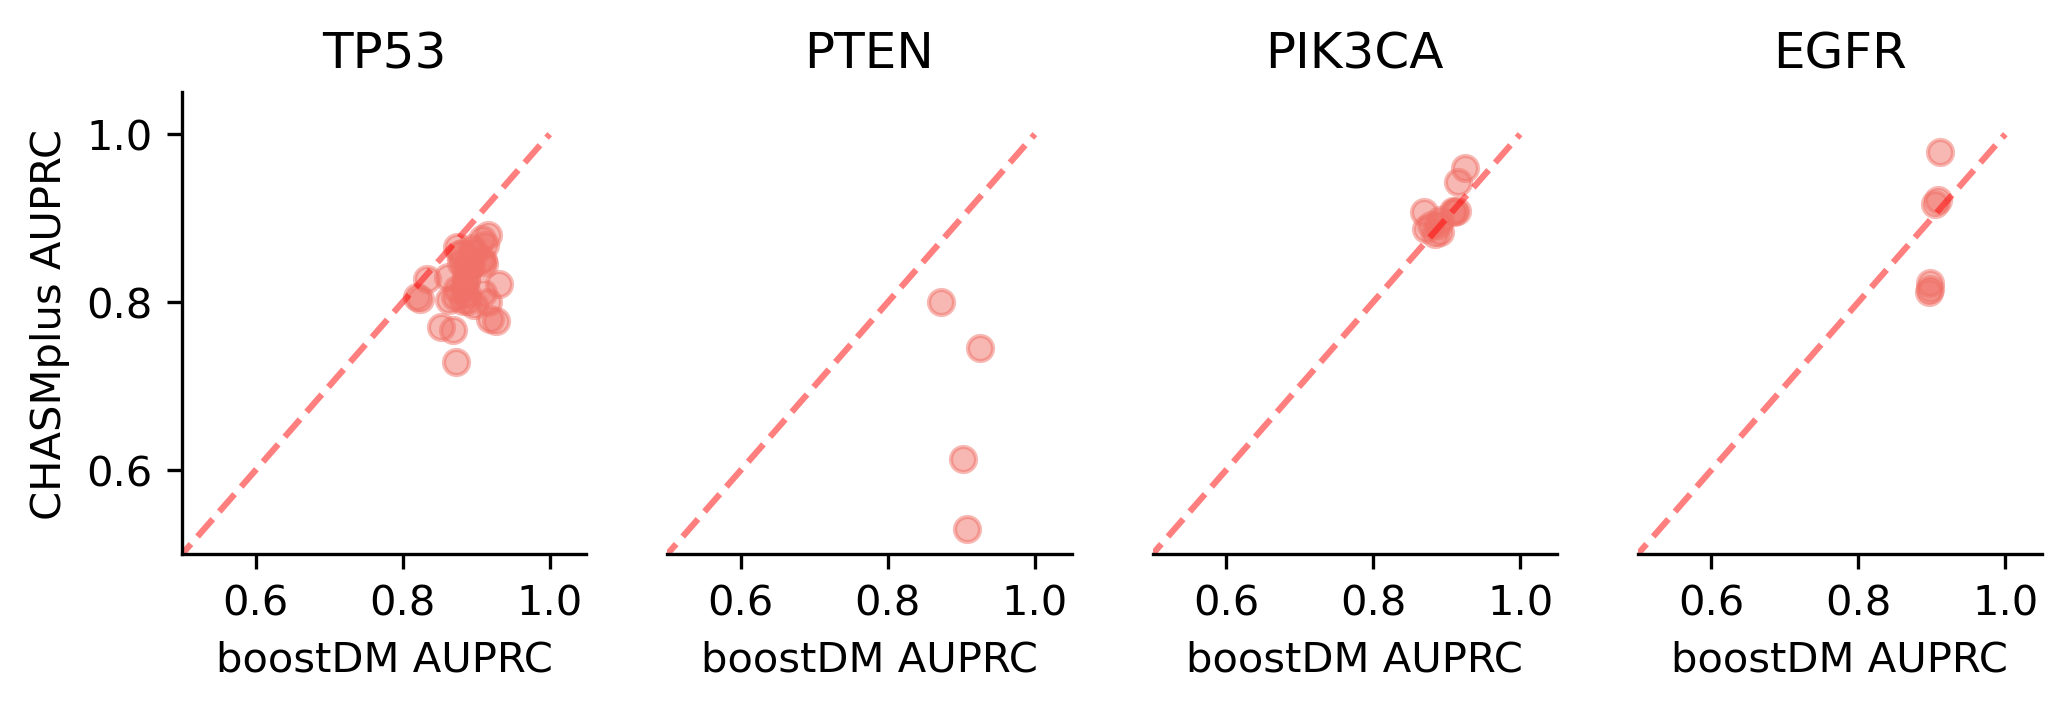
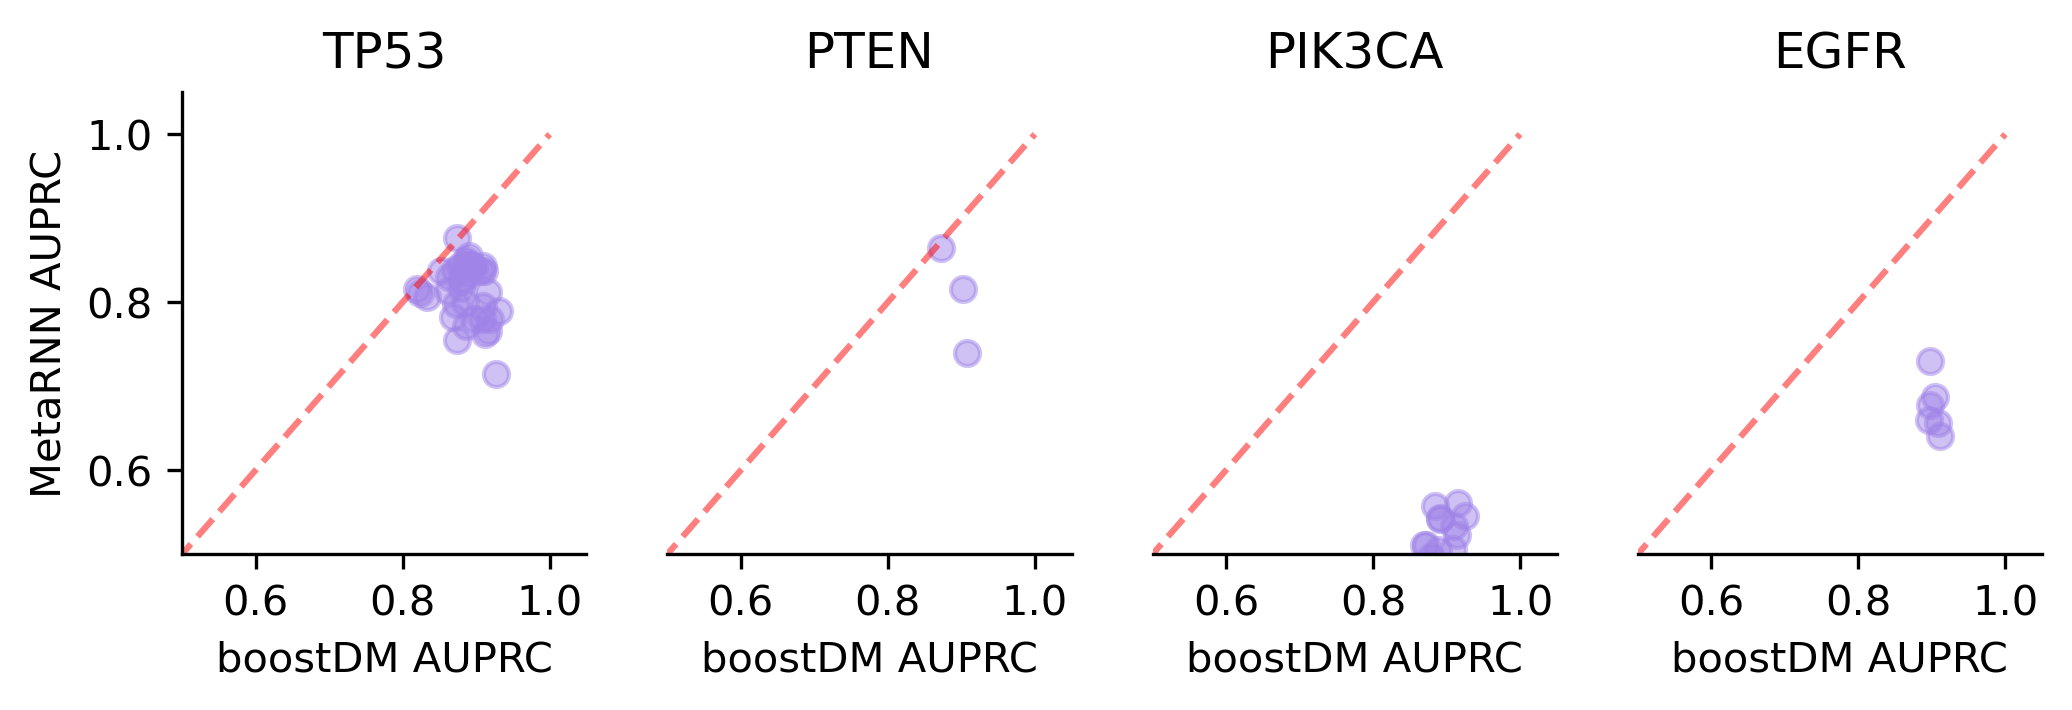
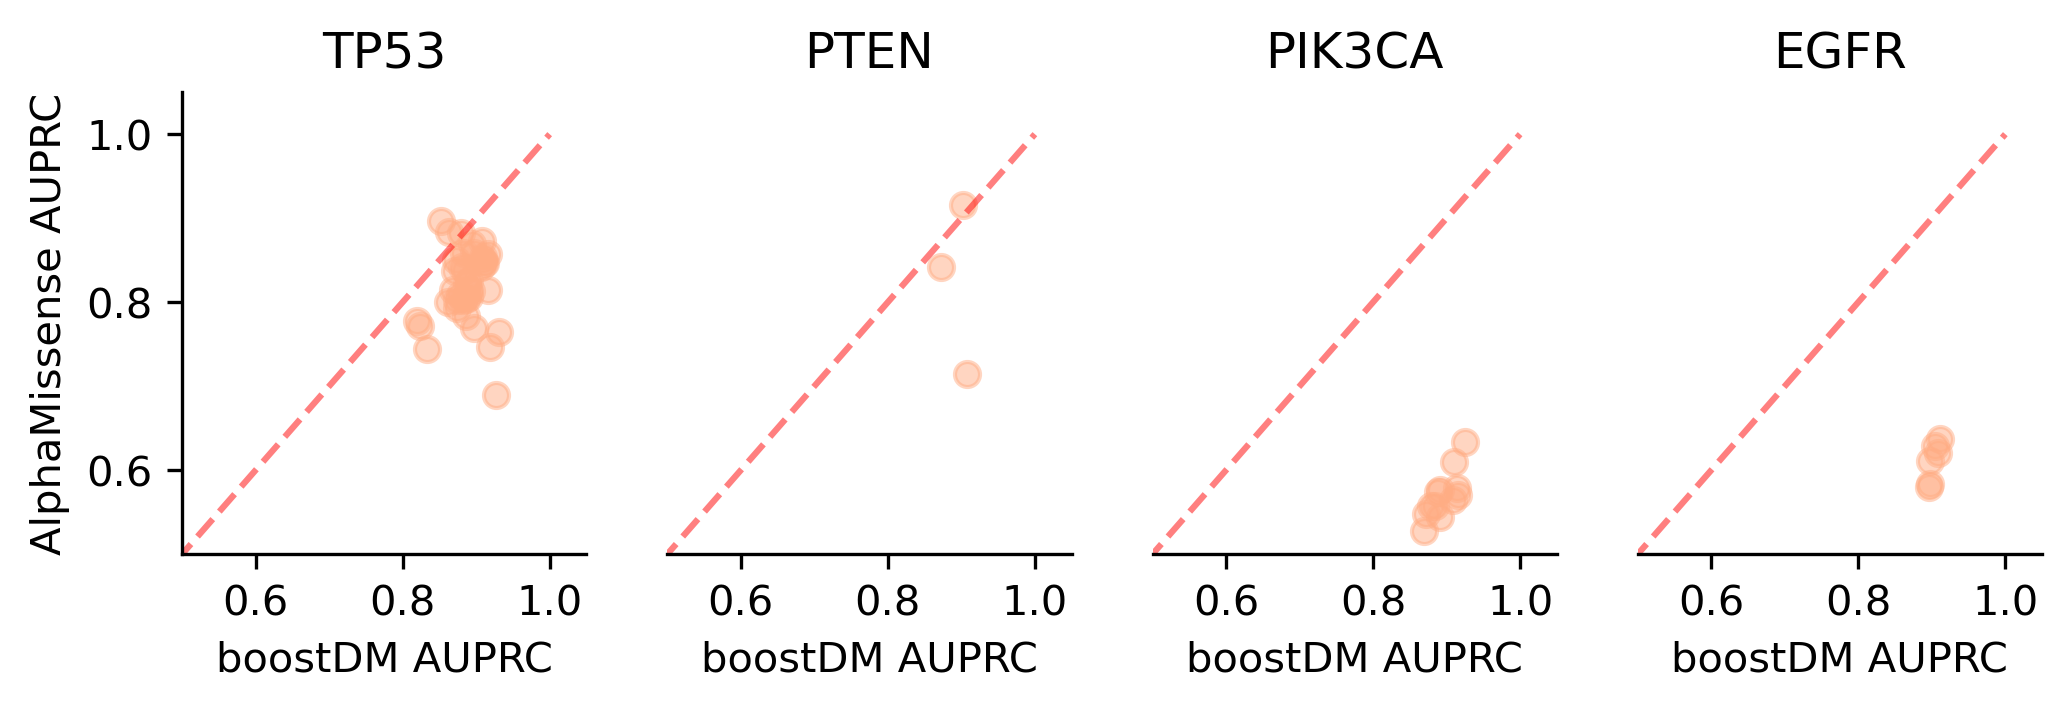
The evaluation of bioinformatic scores allowed us to compare the boostDM performance across a rich set of gene tumor type models, potentially the 736 gene tumor type combinations corresponding to high-quality models according to our model selection criteria. For a high proportion of gene and tumor type models and scores the comparisons were robust enough, with some exceptions where the number of mutations was insufficient to draw any conclusions.
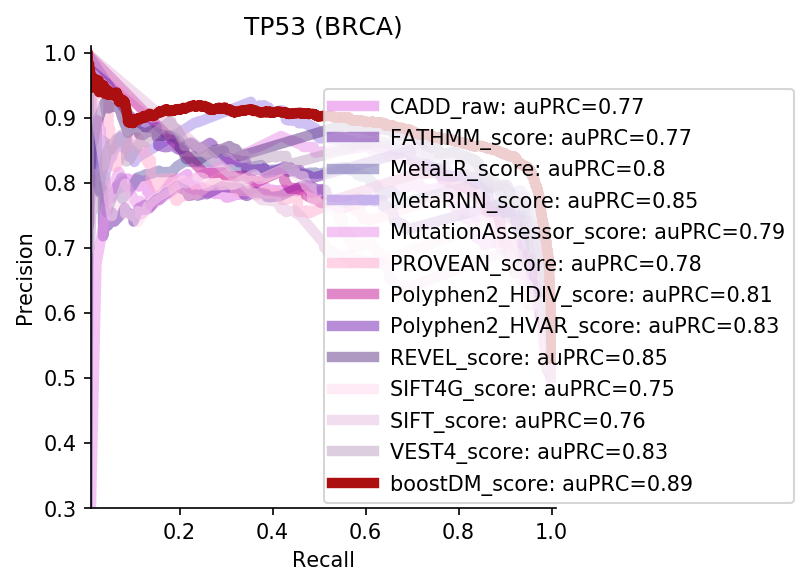
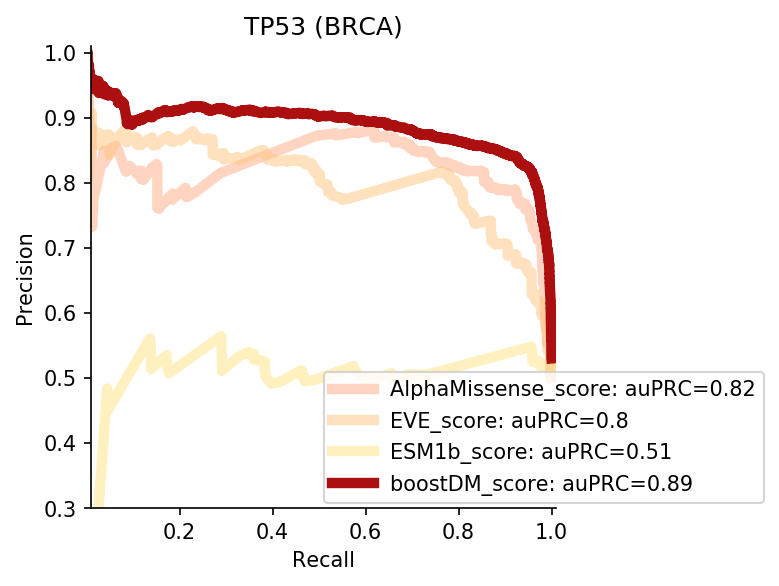
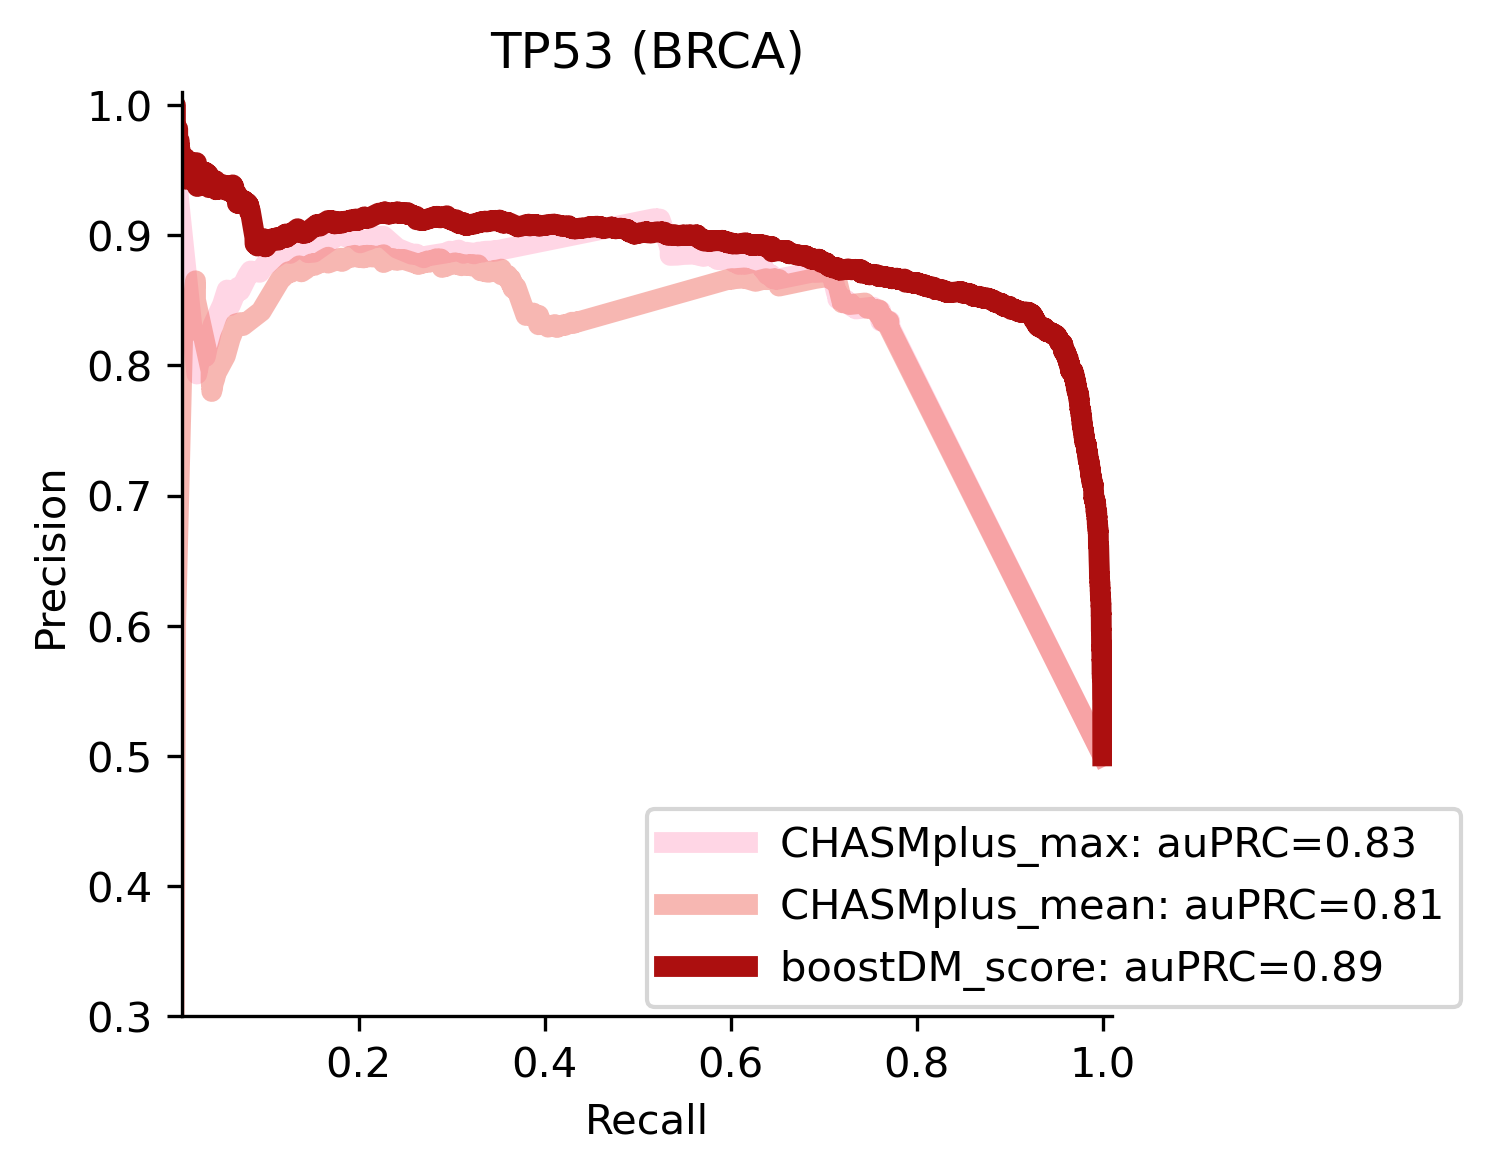
We divided the set of bioinformatic scores into three broad classes: classical pathogenicity scores and meta-scores thereof (CADD, FATHMM, MetaLR, MetaRNN, MutationAssessor, PROVEAN, Polyphen2, REVEL, SIFT, VEST4); recently proposed pathogenicity scores derived from deep generative models (EVE, AlphaMissense, ESM1b); and CHASMplus, which is a cancer-specific pathogenicity score bound to conduct the same classification task sought by boostDM.
In general, boostDM performs similarly or better than the rest of bioinformatic scores, with few exceptions on a gene and tumor type specific basis. Among the bioinformatic scores analyzed, CHASMplus was the one that performed closest to boostDM’s performance for a number of gene and tumor type combinations.